Would that be lovely? At least that's this missive's flow, so let's go!
We start with stocks as they're the sizzle at the moment from which we'll then segué via the Bond into Gold. Perhaps better put, stocks are a-sizzle as if the fat is finally being fried off its bacon. However, this bit of bacon is sufficiently flush with so much fat that the present annual period of volatility is far from correcting the crux of a contingent crash. Specific to the S&P 500: -1.5% on Tuesday, +1.8% on Wednesday, -2.1% on Thursday, -1.2% on Friday -- 'tis nothing, by historical context, but seasonal noise -- at least so far.
You savvy readers out there need not be reminded that during the past 12 years, the S&P has twice conceded to corrections of better than -50%: the Dot-Com Bomb of 2002 and the Sub-Prime Crime of 2008/2009. Yet, so far this year, as measured from the S&P's all-time intra-day high of 2019 a mere three weeks ago through yesterday's (Friday's) low of 1906, we've only a -5.6% pullback. And now bang on time with Carl Icahn noting during Friday's wee hours on Bloomy Radio that "profits are small", we remain diligently expectant of the Look Ma No Earnings Valuation Detonation, (unless the economy has become so scintillating of late that earnings vis-à-vis these lofty price levels simply double to catch up, which so far through the first week of the young Q3 Earnings Season clearly is not the case). Either way, just to review that which has passed:
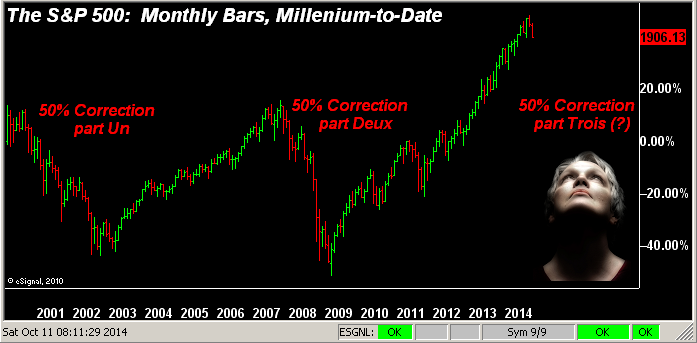
Yes, I realize that earnings have become very "old school" with respect to current prices. Today uncannily, an improving economy is now viewed as poor for the stock market as interest rates invariably must back up. Today uncannily, preference is for a recessing economy, the free Fed dough being the proven motivator for the masses to be in the market, for it then only goes up.
Back in the day, the stock market conservatively was an inflation mitigant, and aggressively a place for the well-heeled white-collar investor to take some capital risk. But the last two decades have seen the market simply replace the average working stiff's savings account, earnings be damned. I recently came across some verbiage with respect to lump-sum pension fund distributions, (apparently becoming the "in thing" in which to partake these days), strongly urging that such proceeds be invested in the stock market so as to keep up with the rising cost of living. Our long-running S&P quip about "sittin' on the bid at 880" might make that an attractive entry point, but not from here at 1906 given our calculation of the S&P 500 price-to-earnings ratio of 35.3x, which being "live" is net of this -5.6% downside blip.
To be sure, the market in the midst of the past week did have that wondrous Wednesday, the venerable Reuters brilliantly running with "Stocks roar Fed approval" on reassurances that our Federal Reserve Bank shan't race into raising interest rates. ('Course the next day, the same mighty news service ran instead with "Shares hit six-month low as growth worries mount"). But why count? Moreover, shouldn't that be inspiration for the next round of Quantitative Easing, and in turn be the motivation to stay in the market for its next doubling? Below we've someone who's already in the know.
The wise old owl known as Mr. Bond certainly appears to have had a séance with the Sybil, who sweetly whispered into his ear that rate rises are not in her vision of the future. Speaking to which, the 30-Year Treasury Bond futures yesterday traded to all but as high as they've been in better than a year, not to mention near to their high of 2008's Black Swan, the turbulence of that event having not even kicked in (as yet). Here are those US T-Bond futures month-by-month from 2008-to-date:
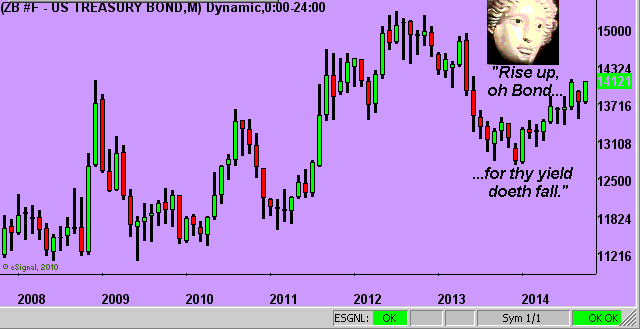
To quote Mark Twain, Mr. Bond has indeed stated: "The report of my death was an exaggeration." Absolutely spot-on, for the Bond's yield has fallen from last December's 3.976% high down to yesterday's 3.035% settle, the long-end of the curve losing quite a bit of steepness there. And as for the so-called "Dollar strength", the past five days saw the Buck's largest intra-week high-to-low Index drop since that ending 12 July 2013.
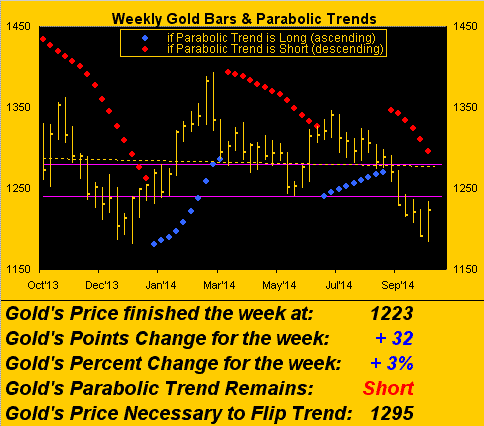
The net effect of these noted S&P/Bond/Dollar alterations have thus once again given grippity to Gold, which after coming within two points on Monday of last year's low (1182), rebounded upward to finish with a week's gain of 3% at 1223, the best single weekly performance of the last 16, (since that ending 20 June). And as we turn to this next chart of Gold's weekly bars, the declining parabolic red dots have accelerated to a down-pace of better than -15 points/week, meaning that were Gold to put in another robust up week or two such as to eclipse those dots, 'twould be the briefest Short trend since the summer of 2013, meaning that the Sellers 'n Shorters are becoming Sold Out such that the move down from 2011's All-Time High of 1923 is likely ending. 'Course, our not actually having the insight of the Sybil herself, we can only say that in a broad sense, especially given this past week's solid performance, Gold's price continues to at least consolidate. And from the look of this chart, a meeting of ascending price with descending dots appears destined to occur within the 1240-1280 resistance zone bounded by the purple lines:
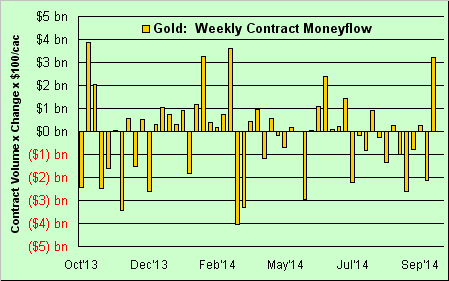
Further substantiating Gold's vigorous up week, here we've the contract-traded moneyflow bars, similarly week-by-week from a year ago-to-date. Calculated by weekly contract volume x price change x $100/contract, this past week was comparably as strong as any for monetary flow into Gold year-over-year. However, what's been admittedly problematic within the overall broad price consolidation is the lack of follow-through in the weeks after such moneyflow surges:
Now zooming in on the last 21 trading days (one month), regular observers of the BEGOS Markets are surely aware that all of them, save for the Bond, are down, (including the secondary markets therein, i.e. the Swiss Franc, Silver and Copper). But amongst the five primary components that comprise BEGOS, Gold ranks second in performance only to the Bond over the last month:
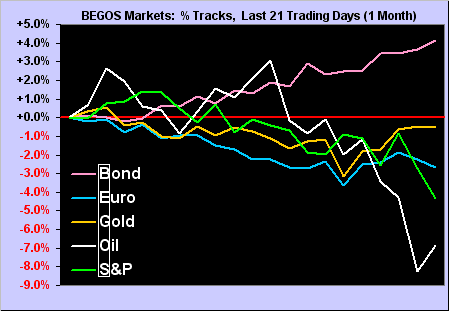
In fact, with respect to Oil's having been clobbered over these last few weeks, you might fax the above chart to your local petrol station, just to make sure they shan't lolly-gag about for too long before lowering their prices. Why here in San Francisco, we might even see sub-$4.00 for a gallon of fuel for the first time since my hair went grey.
"Be happy you have some, mmb..."
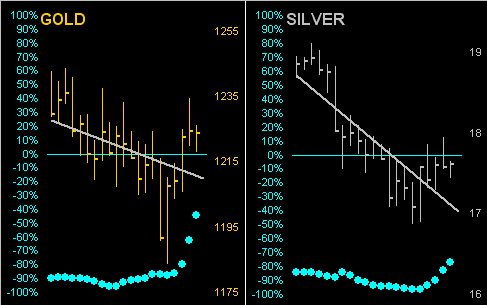
Quite, Squire. As for the "have nots" out there -- namely Gold and Silver who seemingly "have not" mainstream portfolio ownership -- we just may be seeing their respective tides finally beginning to turn north. Whilst no technical study is ironclad in reliability, one upon which we regularly rely for the earliest suggestion of trend change is that dubbed the "Baby Blues" which characterize the consistency of a market's 21-day linear regression trend. And as you can see below for both Gold and Silver over the last 21 trading days, although the diagonal trend lines remain negative, the rising blue bots signify those trends as losing their downside consistency. Put another way, the persistence of selling has changed to being scattered at best, as not just short-covering but hopefully positioned buyers are beginning to populate the trading premises:
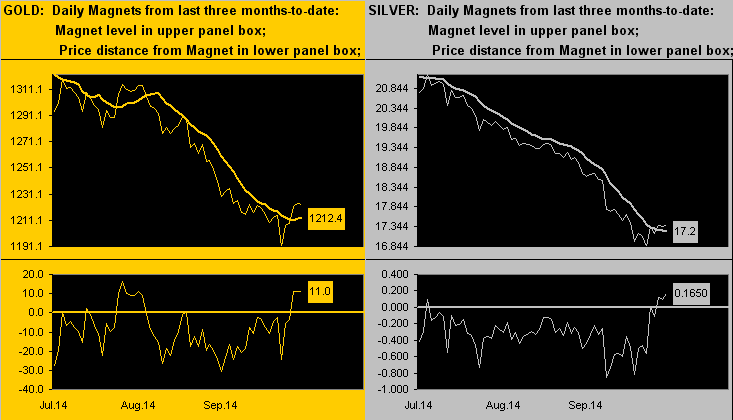
Next we pair up this charming couple for the last three months-to-date vis-à-vis their Market Magnets. Designed such that price (thin line) cannot deviate too far from magnet (thick line), in both cases attraction finally has been fulfilled, with Sister Silver notably passing up through her magnet for the first time after being below it for 55 days, more than double any previous duration sub-magnet since we began compiling this data back in 2010! Obviously as we herein saw a week ago, Sister Silver's state of being oversold was sinking beyond silly:
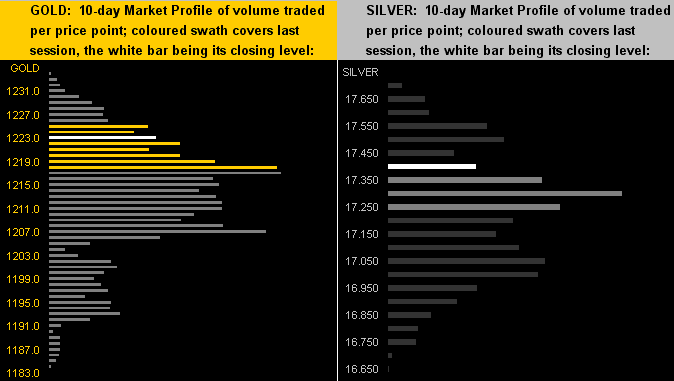
And finally here are their respective 10-day Market Profiles. Gone from a week ago are prices' levels that were down amongst the deep sea denizens. Both markets are now back above water from their profile perspectives, Gold's notable trading supports being 1218 and 1207, and for Silver 17.300:
Let's close it out for this week with the following three notes:
1) In a week's time we'll herein review the Economic Barometer as 'twill have been affected by a barrage of incoming data through next Friday. The FinMedia rightly are rife with coverage of slumping growth in Asia and extensively so 'twould appear in the EuroZone, for when factory orders in Germany -- the veritable centerpiece of the Zone's economy -- slump to five-year lows as industrial production wanes, the European Central Bank shall almost certainly be pressured to ramp up purchases of sovereign debt. To the extent that this slowing global growth contagion hits us StateSide ought well show up in the Econ Baro, (which of course you can watch unfold by the day at the website).
2) This is not so much of a correction from that which we wrote a week ago, but rather a clarification. A valued sharp-eyed reader emailed us that 'twas incorrect to note France as ranking fifth in the world in total holdings of Gold tonnage, outranking the combined holdings of China and India. The figures we assessed were as compiled by World Gold Council, which this particular reader noted tends to focus only on government holdings whilst overlooking those of the private sector, particularly in Asian countries. 'Tis beyond our capabilities to substantiate private holdings estimations, but they apparently place India and China as far and away the leaders. And given the rate at which those two nations purchase Gold, I ought not doubt it.
3) Finally, this coming January looks to be your last opportunity to network -- at least on the cheap -- with the planet's financial wizards at the World Economic Forum's annual bash in Davos, Switzerland. Effective mid-year 2015, the annual membership entry fee alone is to sport a 20% increase from SFr500,000 to SFr600,000. Which begs the following question, given the aforementioned economic slowing of Asia and moreover the deflationary environment of the EuroZone: should not the fee instead be reduced? What am I missing?