Overvalued No Matter How You Look At It
Currently, stocks are extremely overvalued by multiple methods.
- The first way is by looking at Cyclically Adjusted P/E Ratios commonly known as CAPE, Shiller P/E, or P/E 10 ratio.
- The second is by looking at median P/E and P/S (Price to Sales) measures
We will look at both, but here's a description of CAPE.
CAPE is a valuation measure applied to stock market indexes. It's defined as price divided by the average of ten years of earnings (Moving average), adjusted for inflation. The essential idea is earnings are mean-reverting making forward looking earnings frequently too optimistic, and current PEs too high following steep corrections.
CAPE is not without its detractors and debates have raged over its usefulness recently, just as they do at every major market peak when investors find all sorts of silly reasons to presume "It's different this time".
Stocks More Overvalued Now Than Ever
I will post a CAPE chart in a bit, but for now let's take a look at another PE measure I first saw described today.
The idea is from Ned Davis, but written up by Mark Hulbert in Opinion: Stocks are more overvalued now than at 2000 and 2007 peaks.
Median NYSE Stock’s Current P/E and P/S Ratios Sparks Concern
The stock market currently is even more overvalued than it was at the bull market peaks of both March 2000 and October 2007 — according to not just one, but two, valuation measures.
That at least is the message of an analysis released earlier this week by Ned Davis Research, the quantitative research firm. What caught my eye in the firm’s analysis was that, unlike virtually all others that conclude that stocks are overvalued, this one was not based on the so-called Shiller P/E — the cyclically-adjusted P/E ratio championed by Nobel laureate Robert Shiller of Yale University.
That’s noteworthy, since there would be nothing new in reporting that Shiller’s P/E shows stocks to be overvalued. That ratio has been giving this same message for several years now, and skeptics have found many ways of wriggling out from underneath its bearish implications.
But Ned Davis’s latest report focuses on something different: the median stock’s price/earnings and price/sales ratios. The median stock, of course, is the one for which exactly half have higher ratios and half have lower. By focusing on the median, Davis’s findings are immune from the charge that they are being skewed by outliers — such as the terrible earnings among energy companies.
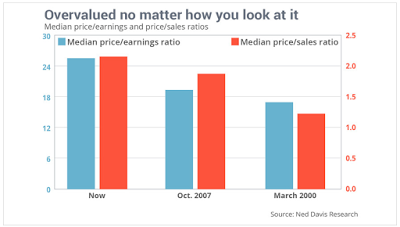
The chart at the top of this column summarizes what Davis found. Currently, according to his firm’s research, the median NYSE-listed stock has a price/earnings ratio of 25.6, when calculated based on trailing 12-month earnings. At the bull market peak in October 2007, for example, the comparable ratio was below 20; at the top of the Internet bubble in March 2000, it was even lower.
In fact, according to Davis, the price/earnings ratio currently for the median NYSE stock is the highest it’s ever been since his data series began in 1980 — except for the bear-market lows of October 2002 and March 2009, when earnings were depressed by recessions.
A similar story is told by the price/sales ratio. The median S&P 500 stock currently has a ratio of 2.16, according to Davis, versus 1.9 in October 2007 and even lower in March 2000. The median stocks’ price/sales ratio has never been higher than it’s been this year.
Stocks Incredibly Expensive
To me this is a nice confirmation of what I already know: that stocks are incredibly expensive. Renown investor Jeremy Grantham at GMO feels the same way.
And GMO's Ben Inker makes a strong case that US equities do not deserve much of a PE premium as noted in Disastrous Discussion: US Corporate Profits vs. GDP: How Sustainable is Corporate Profit Trend? Do US Equities Deserve a PE Premium?
How bad can it get?
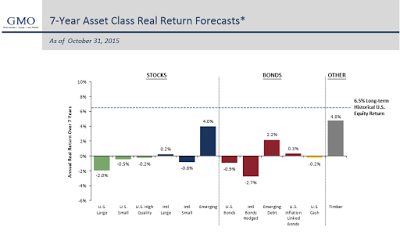
Inker suggests real (after inflation) earnings may range between -4% and +2% every year for seven years, on US large equities, depending on profit margins vs. assumptions. Yes, a 4% real loss every year for seven straight years is a possibility.
Inker does not put odds on any particular number but here is their actual current best guess.
GMO 7-Year Asset Class Real Return Forecasts

The above from latest GMO Forecast.
GMO Disclaimer
The chart represents real return forecasts for several asset classes and not for any GMO fund or strategy. These forecasts are forward‐looking statements based upon the reasonable beliefs of GMO and are not a guarantee of future performance. Forward‐looking statements speak only as of the date they are made, and GMO assumes no duty to and does not undertake to update forward‐looking statements. Forward‐looking statements are subject to numerous assumptions, risks, and uncertainties, which change over time. Actual results may differ materially from those anticipated in forward‐looking statements. U.S. inflation is assumed to mean revert to long‐term inflation of 2.2% over 15 years.
I point out that a 0% for seven years would be disastrous for pension funds expecting 8% returns or better for the same timeframe.
With that let's return to CAPE.
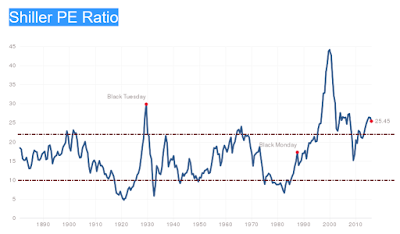
Shiller PE Ratio

The above chart from Shiller-PE. The chart is continually updated.
I added the dashed red lines. Stocks at or approaching the upper red line are in the warning zone. That does not mean a crash is imminent. Things can stay overvalued for years.
Stocks at or below the bottom line are cheap, but they can always get cheaper. Note that in the 2000 crash, stocks did not even drop in the value zone. They did in the 2007-2009 crash, but never reached the point of exceptional value.
In contrast to the Ned Davis median PE valuation method which only looks at current PEs, Shiller-PEs will drop following a crash.
I see viability in both models, you just need to understand what you are looking at. And right now they are pretty much screaming the same thing, at least to me: sell.
Mike "Mish" Shedlock Mike "Mish" Shedlock is a registered investment advisor representative for SitkaPacific Capital Management. Sitka Pacific is an asset management firm whose goal is strong performance and low volatility, regardless of market direction. Visit http://www.sitkapacific.com/account_management.html to learn more about wealth management and capital preservation strategies of Sitka Pacific.

