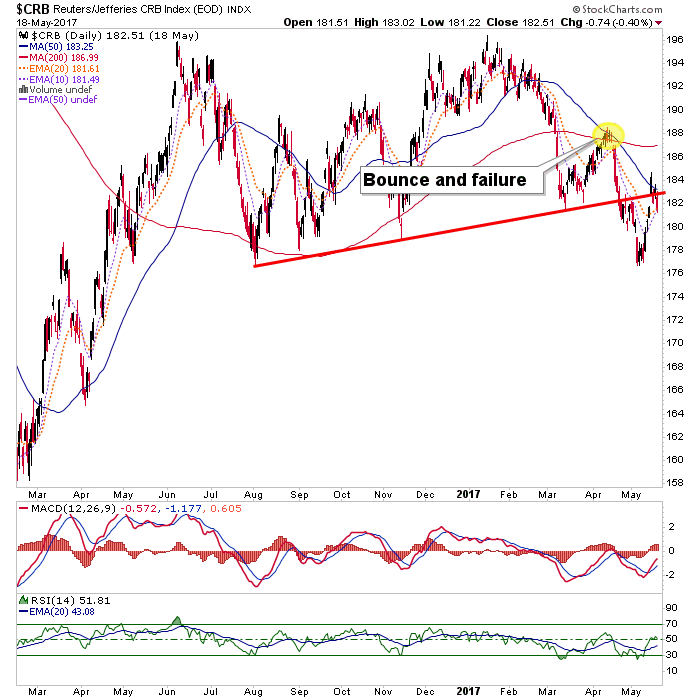
We updated the mostly bearish view on commodities earlier in the week. This includes the current bounce, which is happening exactly as was planned ahead of time. This would be the second such bounce we’ve projected within the intermediate bear trend (sort of opposite the chart of SIMO above). Using this chart we have plotted a bounce target of 182 to 184, with a shot at the SMA 200 (currently 187).
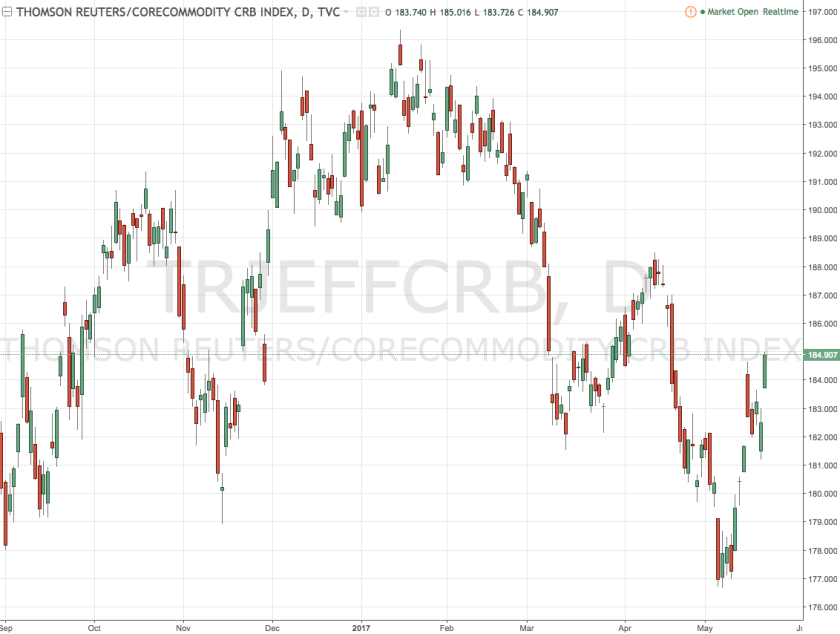
The chart above is as of yesterday’s close. Here is the in-day situation, courtesy of TradingView. A higher high to the last bounce would kill the downtrend. Short of that, CRB is in a bear trend of lower highs and lower lows.
Finally, we move on to the much obsessed over, much cheer-led gold sector. By that I mean gold, gold stocks and the item that should lead the complex, silver. Again, if not for the fact that this article needs to stay within reasonable length and that the fine technical and fundamental details we manage should be reserved for NFTRH subscribers, I’d go on and on here because I think this could be the next big macro play; the next destination for funds that want to anticipate a new bull market and ride it.
This new phase is not yet ready however, and while gold itself has established what is becoming a theme of this article – an intermediate trend (in this case, up) – the balance of the sector has not. Some quality royalty, mining and exploration outfits have joined gold in up trends, but it remains a stock picker’s market. Later, a rising tide would lift even the least sea worthy boats.
The biggest thing I want to highlight about gold and the gold sector is the macro backdrop, ably represented by our handy planetary guide, the Macrocosm.
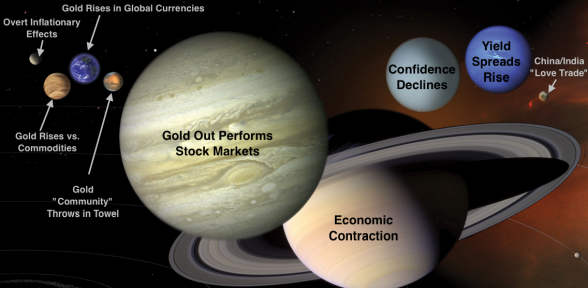
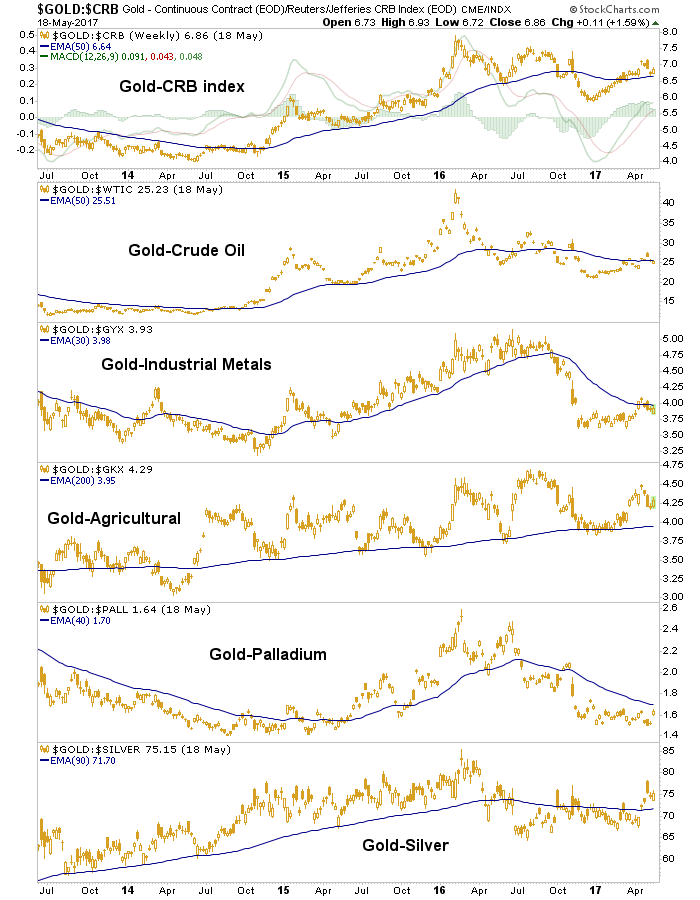
With respect to the proper fundamentals for the gold sector, which in its best investment case is counter-cyclical, the only fundamental underpinning that is currently in place is gold vs. commodities ratios, which have generally been rising in 2017, although even there the trends are not conclusive yet. The biggest planet is gold vs. the stock market and that also relates to the ‘Economic Contraction’ and ‘Confidence’ planets. Confidence in assets positively correlated to the economy simply has not cracked yet and so, the gold sector is simply not ready yet.
Gold vs. Commodities (and silver) is a mixed bag but mostly constructive for a new upturn. We have used Gold/Palladium in particular as a good economic indicator. It has not yet turned counter-cyclical. The reason gold vs. commodities is important to the gold stock sector is because the implication, should the ratios rise, would be rising product (gold) price vs. input costs (energy, materials, labor, etc.).
The above product vs. cost input analysis is known by most people who’ve been around the sector for a while, but where people really get messed up is in expecting inflation to drive the gold sector. Note how tiny the ‘Overt Inflationary Effects’ planet is above; second only to the wacky ‘China/India Love Trade’.
If the inflation has roosted anywhere, it has been in stock markets. Confidence must decline for the gold sector to stand out and that would be reflected in gold rising vs. stock markets. Thus far, it ain’t happening.
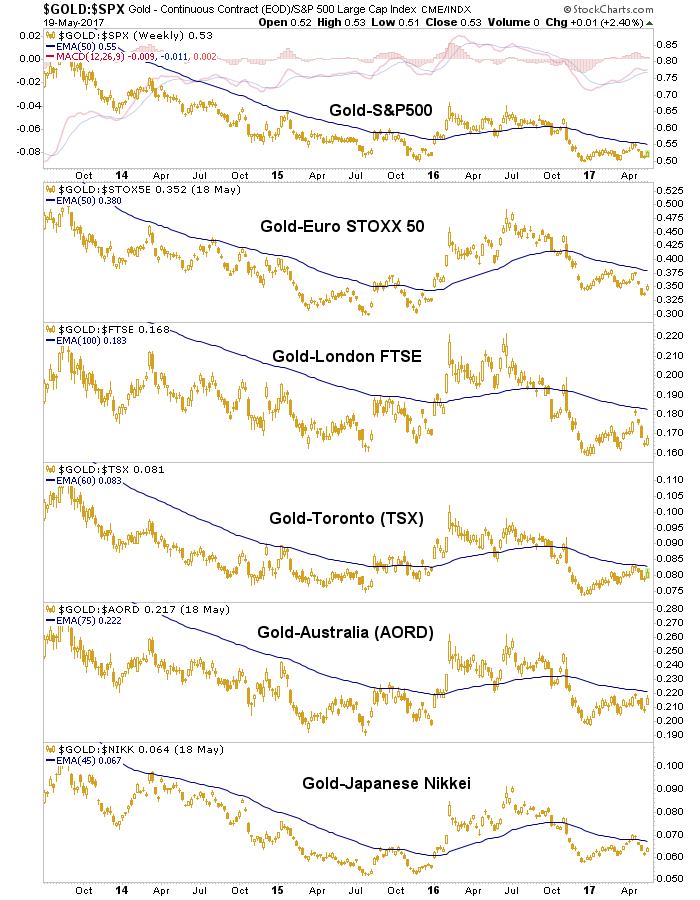
I was going to go into the nominal technicals of gold, silver and the miners, but you get that all over the internet anyway, with chartists drawing their lines, plotting their targets and micro managing every squiggle for enthralled gold bugs while trying to call a sector that routinely confounds such linear analysis. So we’ll leave it at this; the gold sector will be ready when it is ready. There is good reason to believe that we are on a 1999-2001 blueprint, but patience is key.
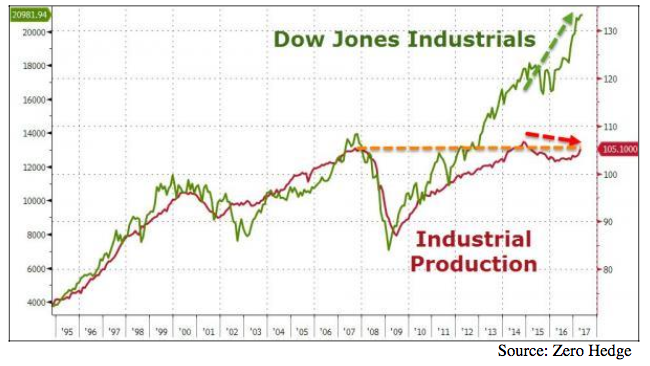
Meanwhile, it is the stock market that is in an uptrend, seemingly mocking the frequent technical top calls and fundamental over valuation calls. I don’t want to make light of these because this graphic from Zero Hedge, by way of Bob Hoye shows just one measure of the over valuation. There are many others.
So the tack I follow and illustrate in NFTRH is one of profit taking, re-planting (ref. the stock examples noted above) and risk management through cash management until current trends start to change. That could be next week or it could be months away after a sensational stock market hysteria and blow off.
When these trends do change sooner or later, the general play would be to sell/short broad stocks (with exceptions, of course), buy the gold sector (only the quality, which may already be in a stealth bull) and later, buy commodities (I am currently short, pending the intact ‘lower high’), which in a logical chain of events would eventually take to the ‘inflation trade’ that gold and silver would sniff out first. These chains of events came into play in both 1999-2001 and 2007-2009 with differing timing and intensity dynamics.
