From the point of view of history, a reversion to generational lows is inevitable, and a valuation level around 50% of GDP for stocks is a fair target.
If we look back to 1981 valuations of stocks and bonds as a guide to valuations at the next generational low, we find stocks and bonds are due for a 75% drop. The Great Bull market in bonds and equities took off after 1981, and has run higher for 34 years (notwithstanding a spot of bother in 2000-02 and 2008-09).
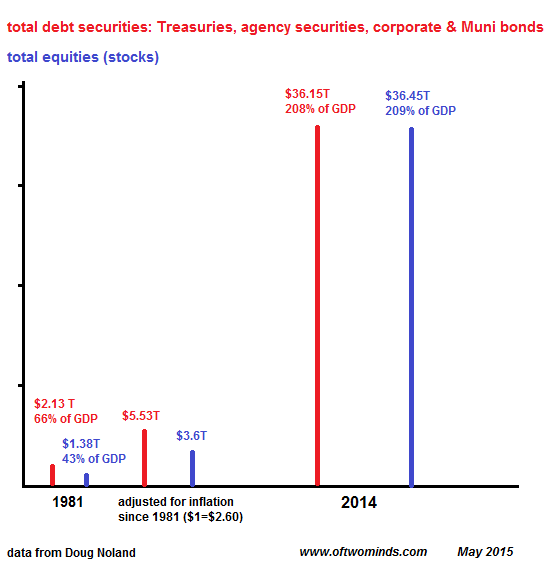
Before credit bubbles became the New Normal, the stock market was valued at less than 50% of GDP. Now stocks are valued at over 200% of GDP, as are bonds. Together, the total securities valuation is over 400% of GDP:

Data courtesy of Doug Noland
The GDP (gross domestic product) of the U.S. was around $17 trillion in 2014. If valuations returned to pre-bubble levels of 50% of GDP, stocks would have to drop from $36 trillion to around $8 trillion--a decline of 75%. Bonds would have to experience a similar decline to reach pre-credit-bubble levels.
A drop back to the rich valuations of 100% of GDP would require a decline of 50% from current levels. In other words, the S&P 500 would be around 1,000, not 2,000.
To provide some context for the extreme valuations of present-day stocks and bonds, I have shown what the stock and bond markets would be worth in current dollars if they had simply tracked inflation since 1981. According to the Bureau of Labor Statistics Inflation Calculator, $1 in 1981 is now worth $2.60 in 2014 dollars.
If stocks had risen only with official inflation, the S&P 500 would be worth 10% of its current valuation: $3.6 trillion versus $36 trillion.
The bond market (Treasury, corporate and Municipal bonds and agency securities) would be worth 15% of the bond market's current valuations.
Measuring the valuations of bonds and equities in terms of GDP bypasses the debate over inflation. GDP has risen smartly in the past 34 years, and so the expansion of securities at the same rate is to be expected--never mind what official inflation registers.
Measured in GDP, stocks and bonds have reached extremes that make no sense except as the result of an unprecedented global credit bubble. Credit bubbles have a history of not being as permanent and durable as those living in the peak of the bubble expect.
By any reasonable measure, the current credit-bubble boom in stocks and bonds is getting long in tooth after 34 years of relentless expansion, and the rise of securities to 400% of GDP is reaching extremes that are increasingly difficult to support, much less push higher.
From the point of view of history, a reversion to generational lows is inevitable, and a valuation level around 50% of GDP for stocks is a fair target. This implies a 75% decline in both stocks and bonds within the next decade, if not sooner.
