Let’s check which stock could magnify S&P 500’s gains in case it rallies, and which stocks would be likely to decline the most if S&P plunges.Here are our stock picks for the Thursday, January 2 – Tuesday, January 7 period.
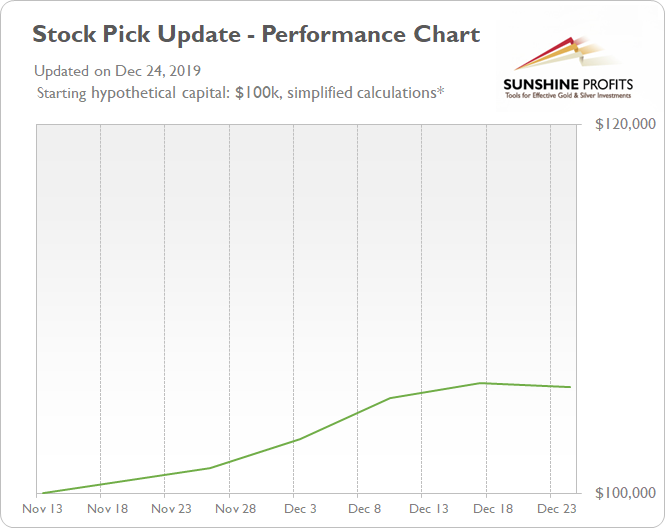
The Stock Pick Update for the December 18 – December 24, 2019 period resulted in a modest loss of 0.2%. Below we include statistics and the details of the previous updates. Only the above - mentioned update for a week-long period ending on December 24 is verified by the alert’s release on our website, but before we decided to make it available to you, we tested our approach and our stock picks performed very well:
Long Picks: Ventas Inc (NYSE:VTR), CH Robinson Worldwide Inc (NASDAQ:CHRW), CF Industries Holdings Inc (NYSE:CF), IDEXX Laboratories Inc (NASDAQ:IDXX), Cincinnati Financial Corporation (NASDAQ:CINF)
Short Picks: Eli Lilly and Company (NYSE:LLY), Morgan Stanley (NYSE:MS), The AES Corporation (NYSE:AES), Duke Realty Corporation (NYSE:DRE), Ametek Inc (NYSE:AME)
Long Result: 1.12% Short Result: -1.31% Total Profit: -0.20%
Long Picks: WMT, FAST, SEE, ZTS, SLB Short Picks: BMY, PSX, SST, LW, EMR
Long Result: 2.45% Short Result: -1.69% Total Profit: 0.76%
Long Picks: PSA, OXY, DE, ILMN, TTWO Short Picks: ZTS, DIS, LW, WELL, PSX
Long Result: 0.87% Short Result: 1.30% Total Profit: 2.17%
Long Picks: PSA, EXC, FANG, ILMN, FLT Short Picks: ABBV, NVDA, CHTR, WELL, AEP
Long Result: -0.03% Short Result: 1.55% Total Profit: 1.53%
Long Picks: VTR, YUM, HAL, ADI, CME Short Picks: MSFT, JPM, ABT, WELL, LOW
Long Result: 1.89% Short Result: -0.50% Total Profit: 1.39%
The broad stock market has reached historically high levels recently. Last year’s breathtaking December correction was followed by the record-breaking comeback rally. The late October – early November breakout led to another leg higher, as the S&P 500 index broke above the 3,200 mark. But will the rally continue? If the market goes higher, which stocks are going to beat the index? And if it reverses down from here, which stocks are about to outperform on the short side?
We will provide stock trading ideas based on our in-depth technical and fundamental analysis, but since the main point of this publication is to provide the top 5 long and top 5 short candidates (our opinion, not an investment advice) for this week, we will focus solely on the technicals. The latter are simply more useful in case of short-term trades.
We will assume the following: the stocks will be bought or sold short on the opening of today’s trading session (January 2) and sold or bought back on the closing of the next Tuesday’s trading session (January 7).
First, we will take a look at the recent performance by sector. It may show us which sector is likely to perform best in the near future and which sector is likely to lag. Then, we will select our buy and sell stock picks.
There are eleven stock market sectors: Energy, Materials, Industrials, Consumer Discretionary, Consumer Staples, Health Care, Financials, Technology, Communications Services, Utilities and Real Estate. They are further divided into industries, but we will just stick with these main sectors of the stock market.
We will analyze them and their relative performance by looking at the Select Sector SPDR ETF’s.
Let’s start with our first charts (charts courtesy of www.stockcharts.com).
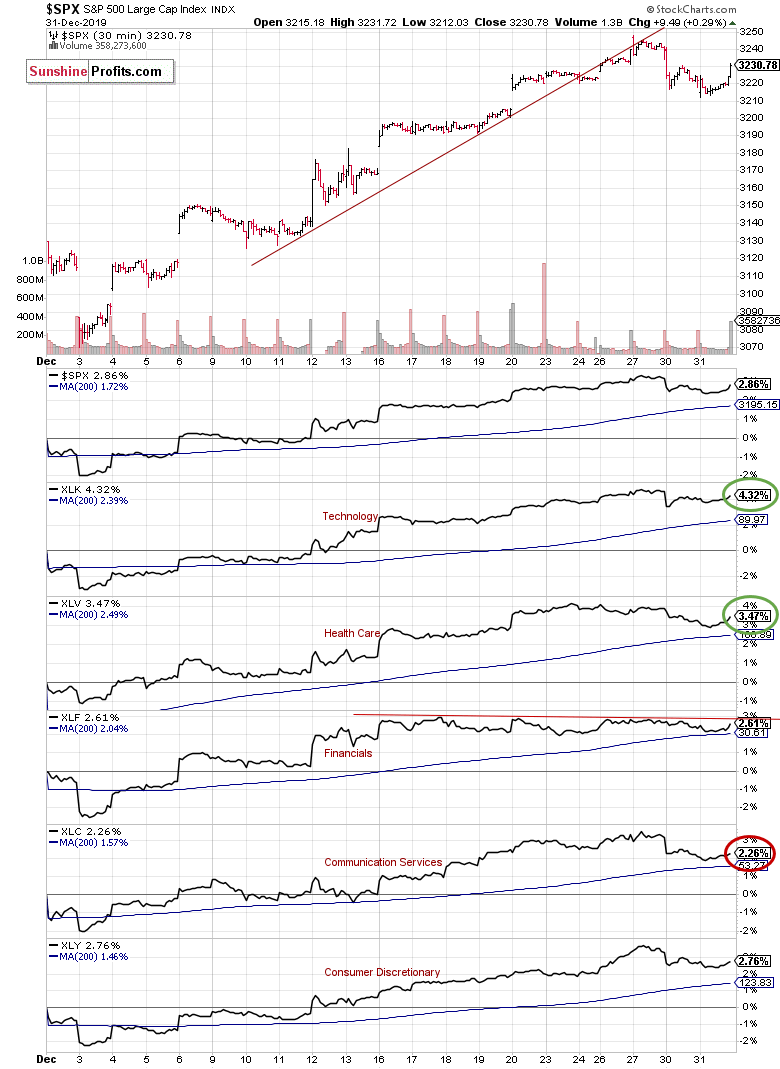
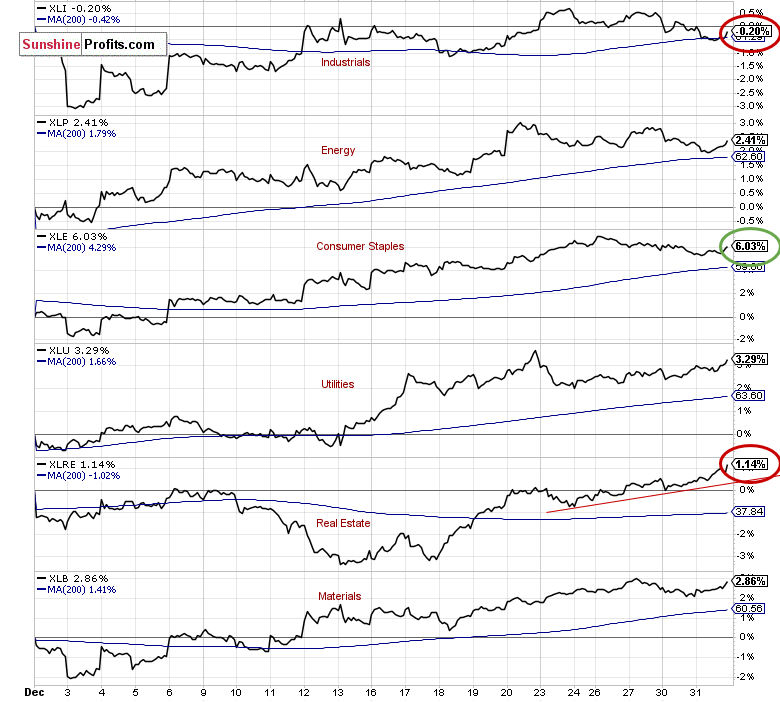
There’s aS&P 500’s 30-minute chart along with market sector indicators for the past month. The S&P 500 index has gained 2.86% since December 2. The strongest sector was Consumer Staples XLE (NYSE:XLE), as it gained 6.03%. The Technology XLK gained 4.32% and the Health Care XLV gained 3.47%.
On the other hand, the weakest sector was Industrials XLI, as it lost 0.2%. The Real Estate XLRE gained just 1.14% and Communication Services XLC gained 2.26%in the last 30 days.
However, the Real Estate XLRE trades within a strongest short-term uptrend, and the Financials XLF is the weakest in the short-term
Based on the above, we decided to choose our stock picks for the next week. We will choose our top 3 long and top 3 short candidates using a contrarian approach, and top 2 long and top 2 short candidates using the trend-following approach:
Contrarian approach (betting against the recent trend):
Trend-following approach:
Contrarian approach
Top 3 Buy Candidates
GD General Dynamics Corp (NYSE:GD).-Industrials
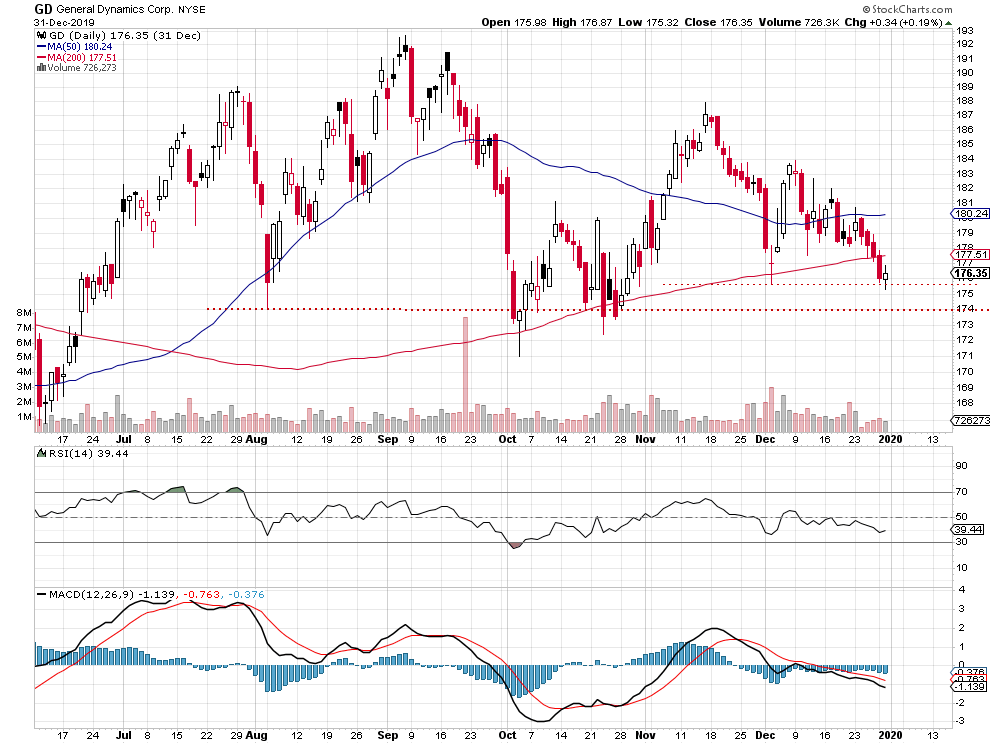
The GD stock trades at its early December local low. Furthermore, there is a potential support level at around $172-174, marked by October local lows. On the other hand, the resistance level is at $180.
CHRW C.H. Robinson Worldwide, Inc. - Industrials
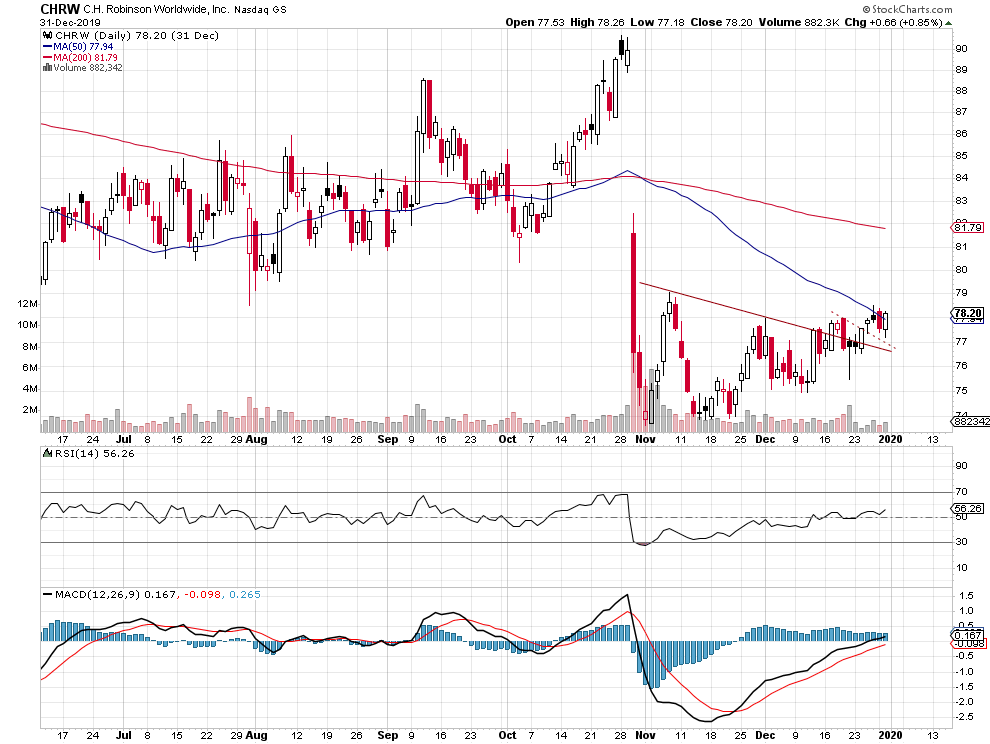
The C. H. Robinson Worldwide Inc. stock is our long pick again. The market broke above its month-long downward trend line recently. For now, it looks like a correction within a medium-term downtrend. However, we could see an attempt at retracing more of the late October sell-off.
CTL CenturyLink (NYSE:CTL), Inc. - Communication Services
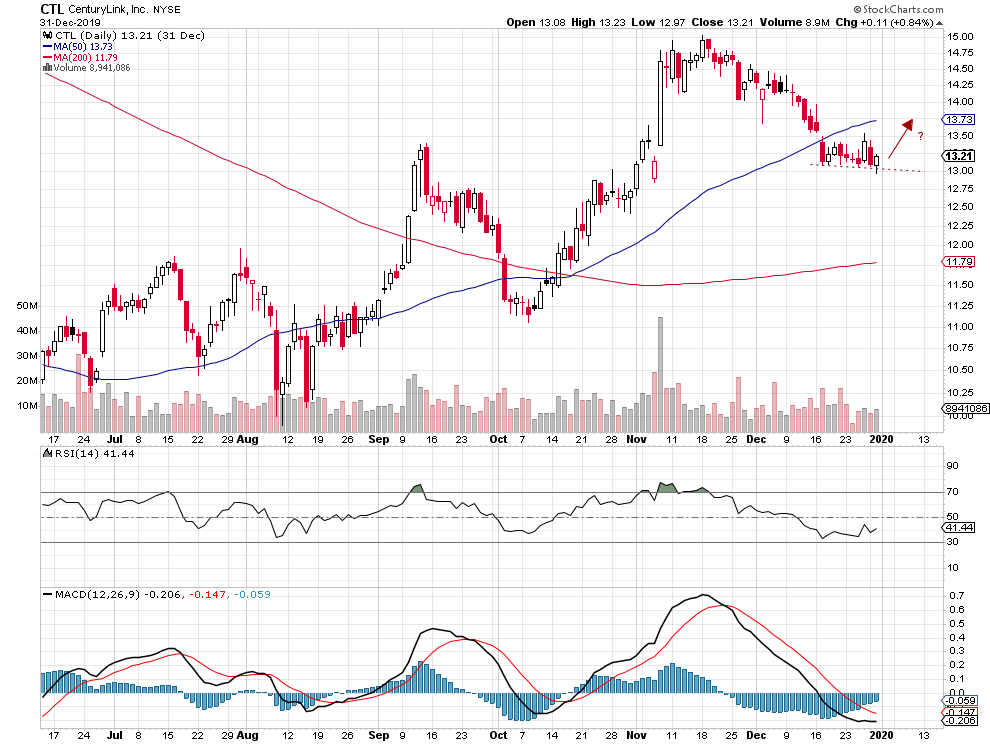
CTL stock remains within a short-term consolidation. The market is at September’s local high that’s acting as a support level. We may see an attempt at retracing some of the declines.
