Upcoming US Events for Today:- Durable Goods Orders for March will be released at 8:30am. The market expects a month-over-month increase of 2.0% versus an increase of 2.2% previous. Excluding Transportation, the order are expected to increase by 0.9% versus an increase of 0.2% previous.
- Weekly Jobless Claims will be released at 8:30am. The market expects Initial Claims to tick higher to 313K versus 304K previous.
- Kansas City Fed Manufacturing Index for April will be released at 11:00am. The market expects 8 versus 10 previous.
Upcoming International Events for Today:
- German IFO Survey for April will be released at 4:00am EST. The market expects the survey of Expectations to decline to 105.8 versus 106.4 previous. Current Assessment is expected to increase to 115.7 versus 115.2 previous. Business Climate is expected to decline to 110.5 versus 110.7 previous.
- Japan Consumer Price Index for March will be released at 7:30pm EST. Excluding Fresh Food, the market expects a year-over-year increase of 1.4% versus an increase of 1.3% previous.
The Market
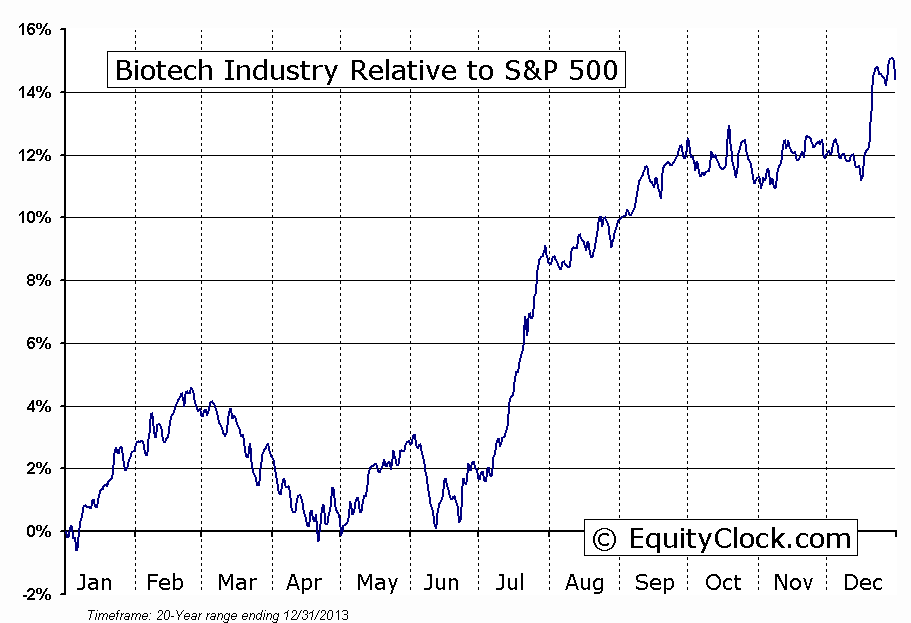
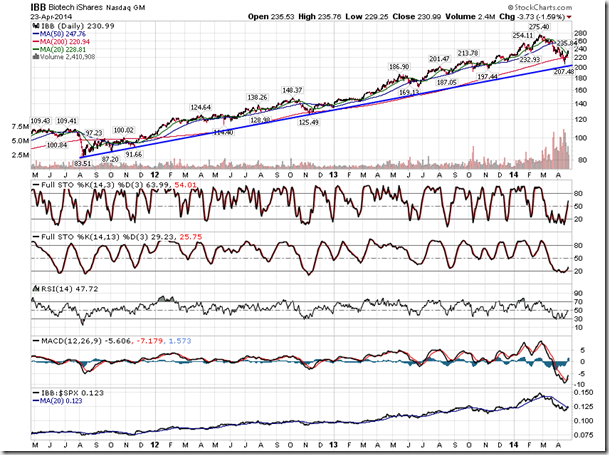
Stocks dipped on Wednesday, dragged once again by momentum stocks, including the recently volatile biotech industry. The Biotech ETF (IBB) declined by 1.59%, dragging upon the already beaten down Nasdaq Composite. IBB recently bounced from a long-term rising trend line following a decline of almost 25%, from peak to trough, since the end of February. Stocks in the industry are attempting to rebound from deeply oversold levels during what is typically a very brief period of seasonal strength that runs from mid-April into the beginning of June; the predominant period of seasonal strength spans from June through to September. As mentioned during my appearance on BNN’s Market Call Tonight on Tuesday, it is best to wait for stocks in this space to settle down and find support closer to the period of seasonal strength that spans the summer months prior to taking a position. Short-term trend of stocks in the industry remains negative and the intermediate trend has also been violated. Momentum is also maintaining a negative slant. A shift continues to be progressing away from high P/E momentum stocks and into value stocks where the risk profile makes more sense around the current equity market highs. This rotation could continue for some time.
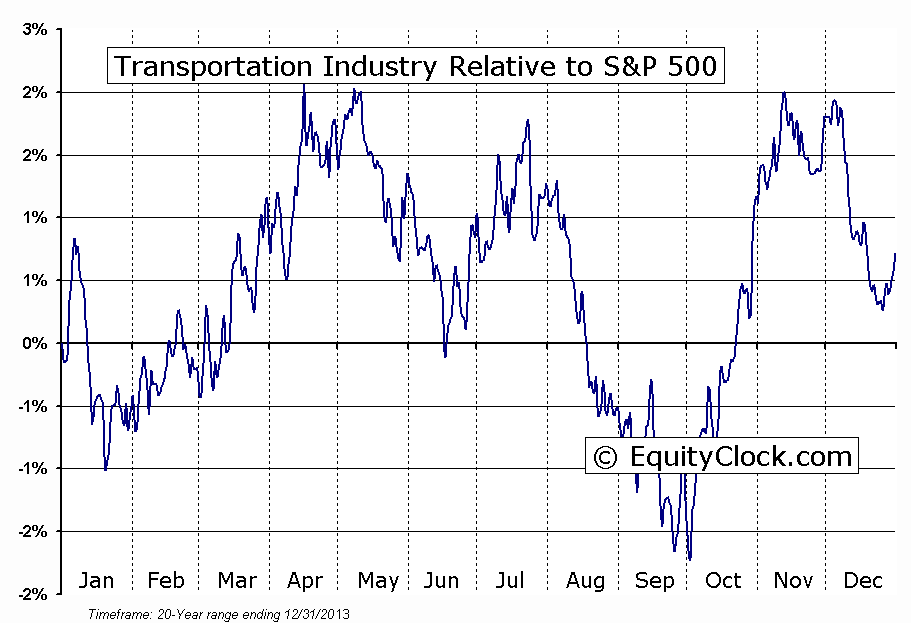
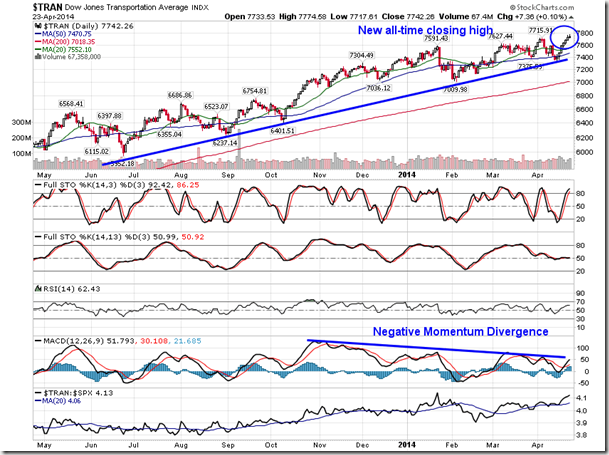
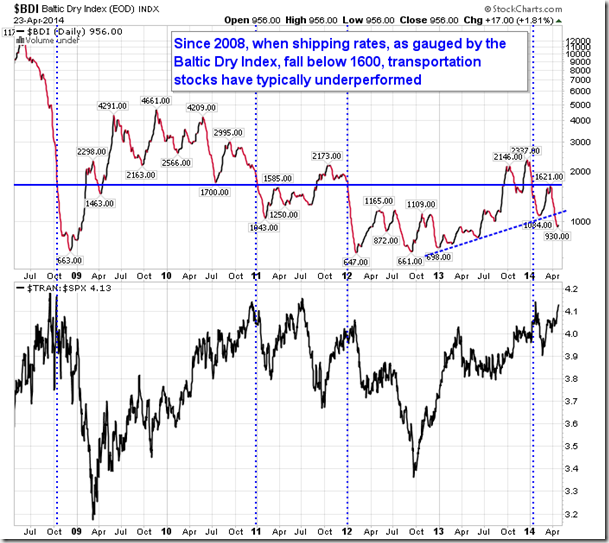
Despite the weakness in the broad market, the Dow Jones Transportation Average continued to chart new all-time closing highs on Wednesday, lifted by strength in the Airline industry. The gains in transportation stocks provides reason to be optimistic of strength in the economy, however, the Baltic Dry Index is suggesting otherwise. The gauge of the price to ship raw materials by sea has fallen almost 60% since peaking in December, breaking a rising trendline that helped to support the index from the lows in 2013. The index has fallen firmly below 1600, a level that has coincided with underperformance of transportation stocks since 2008 as shipping prices put a pinch on profits. The Dow Jones Transportation Average remains in an outperforming position, despite the recent breakdown in the Baltic Dry Index; a divergence has become apparent. Only one is bound to be correct: either the Dow Jones Transportation Average is forecasting that cyclical stocks are to remain strong or the Baltic Dry Index is warning of weakness ahead. The period of seasonal strength for transportation stocks concludes at the beginning of May.
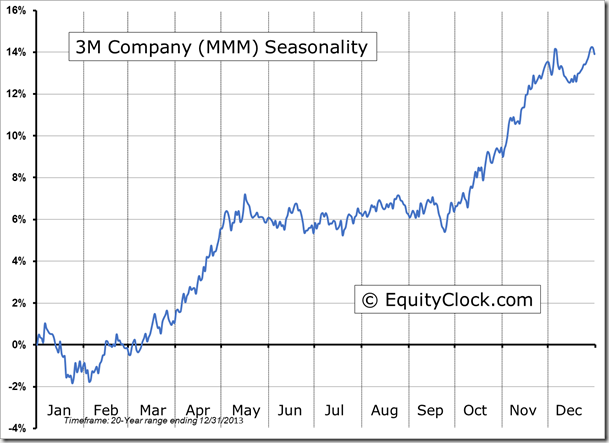
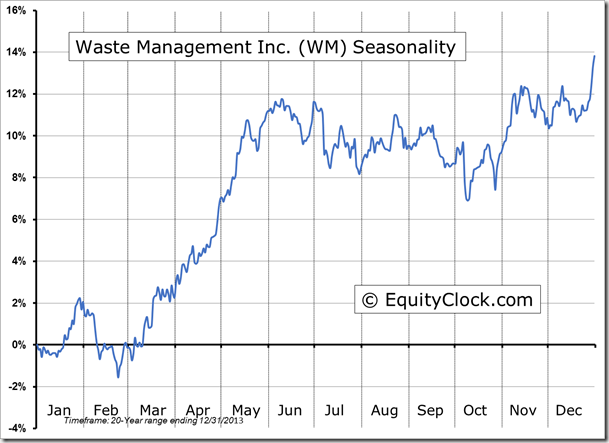
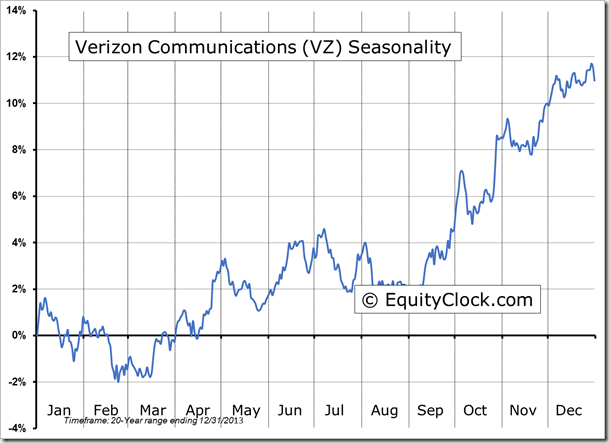
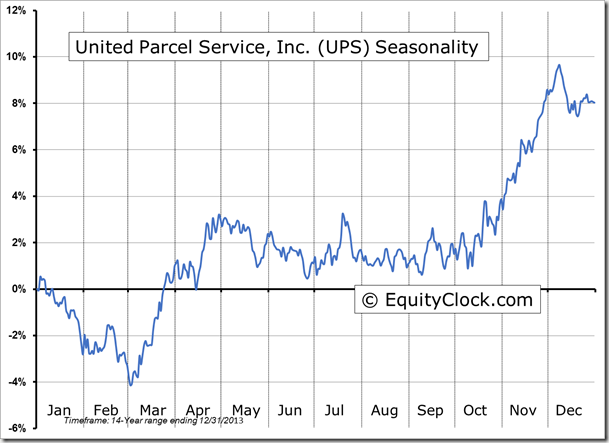
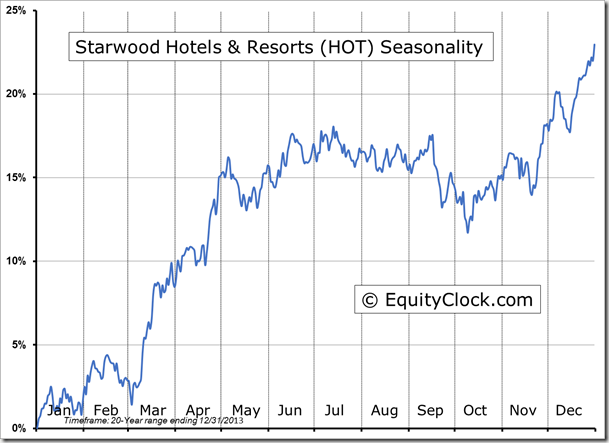
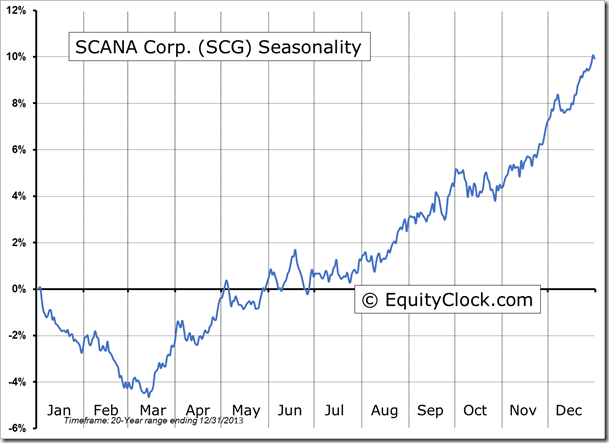
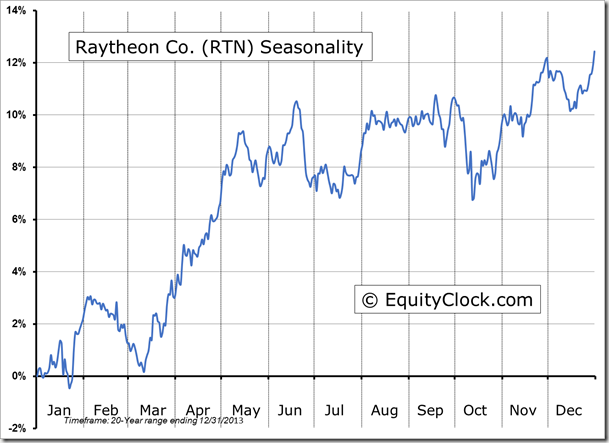
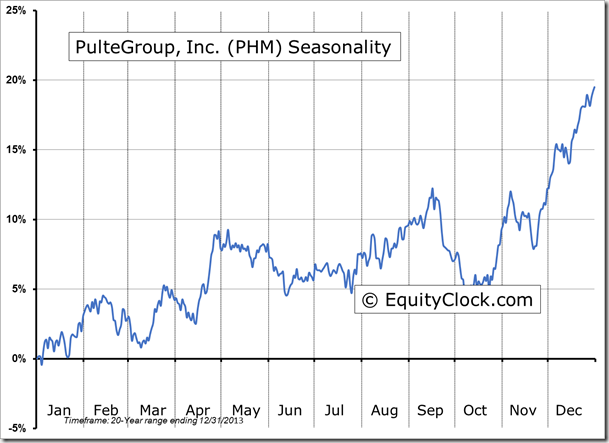
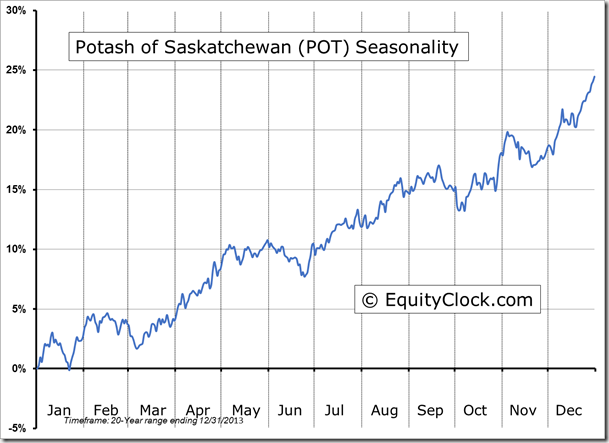
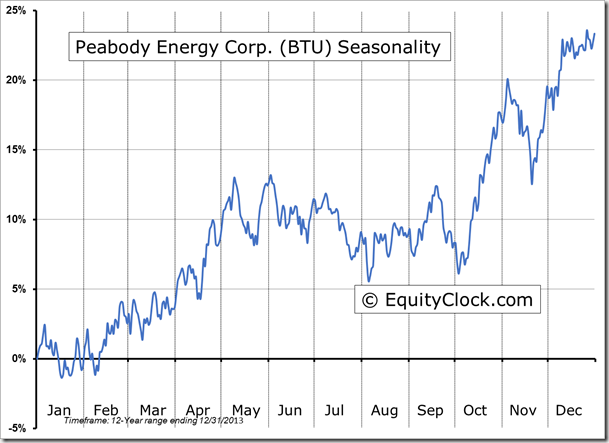
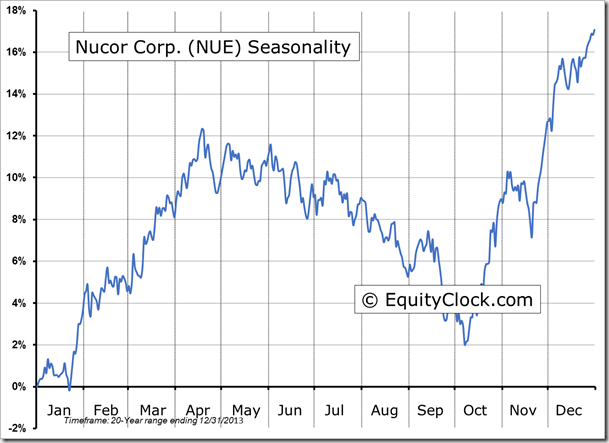
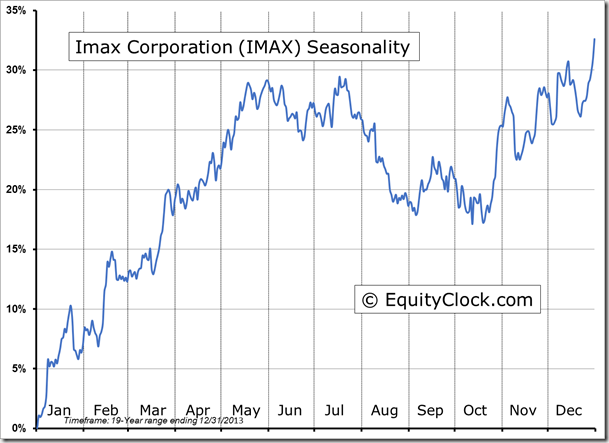
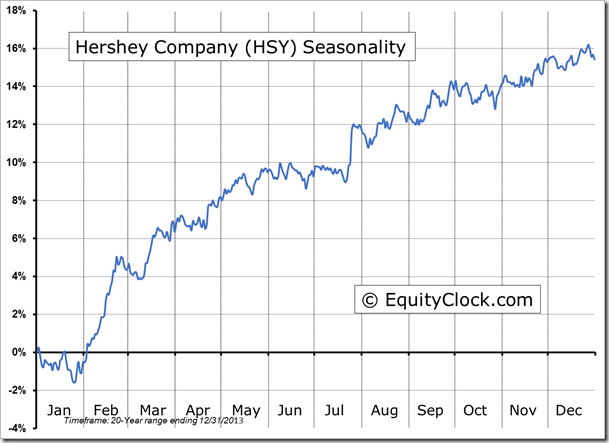
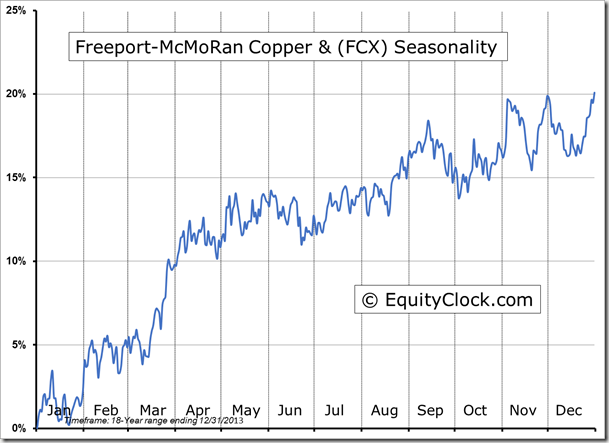
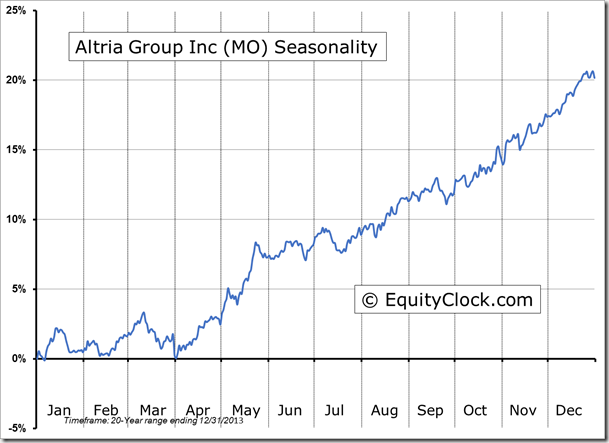
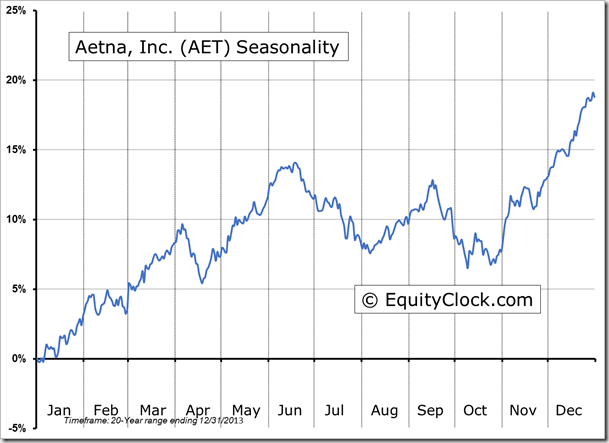
Seasonal charts of companies reporting earnings today:
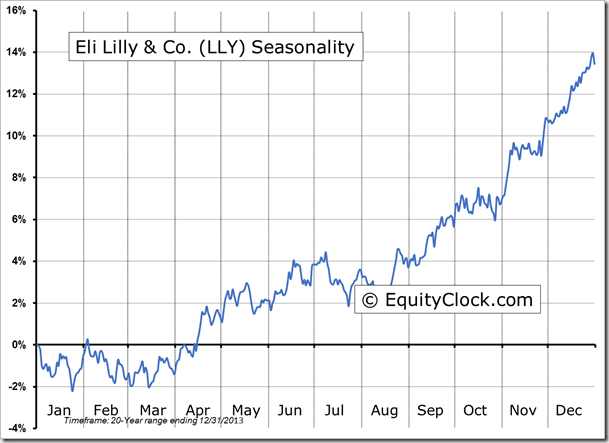
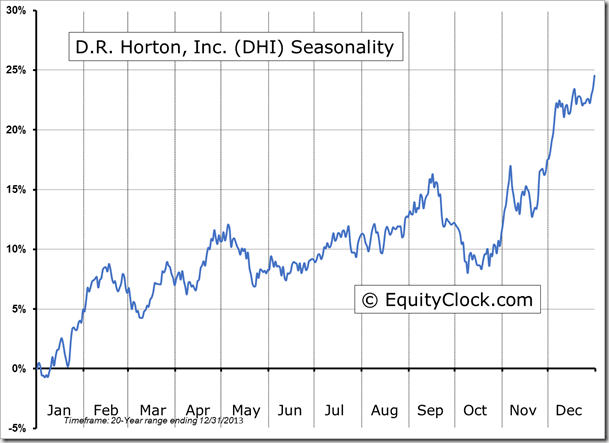
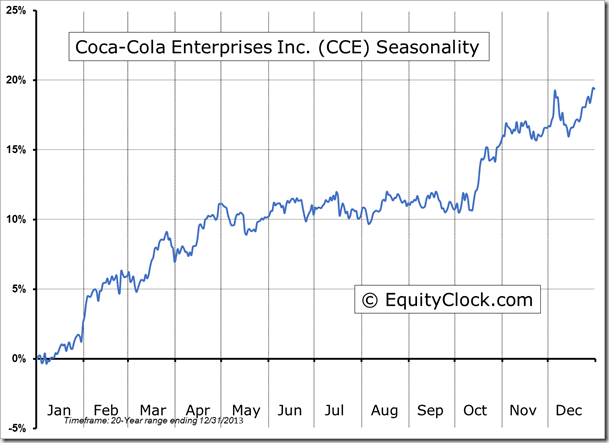
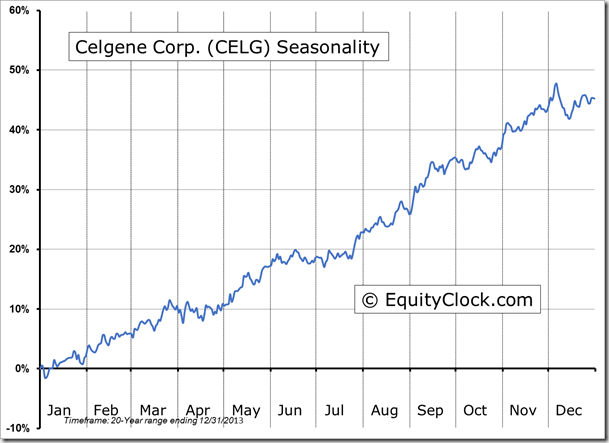
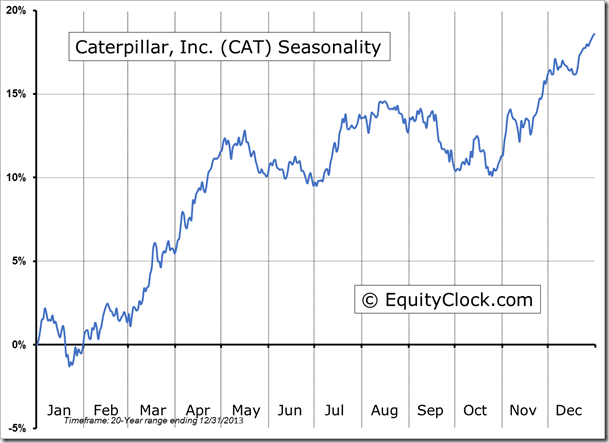
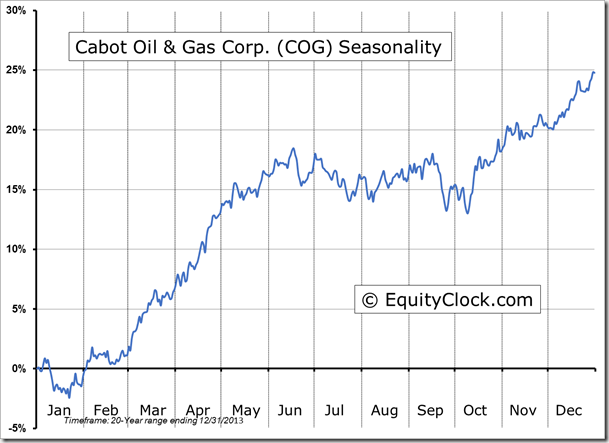
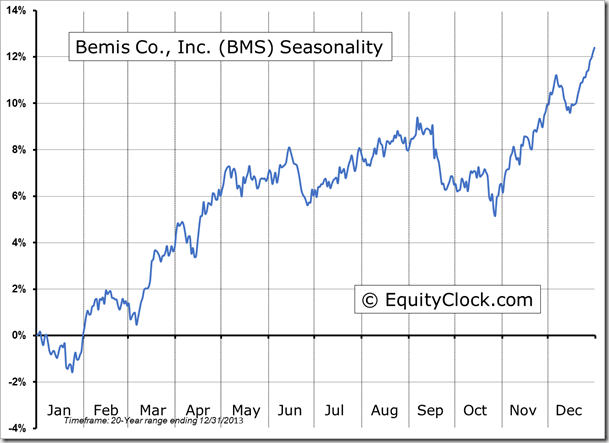
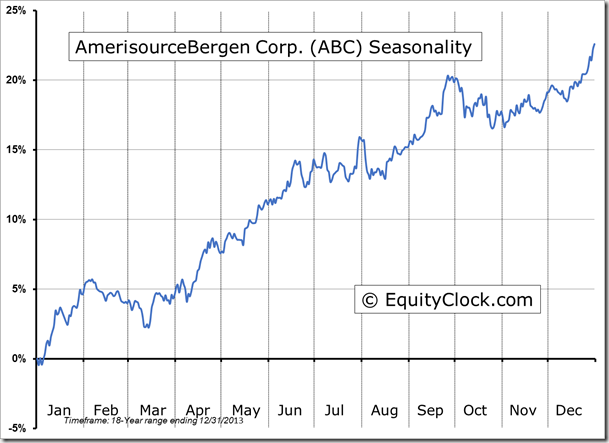
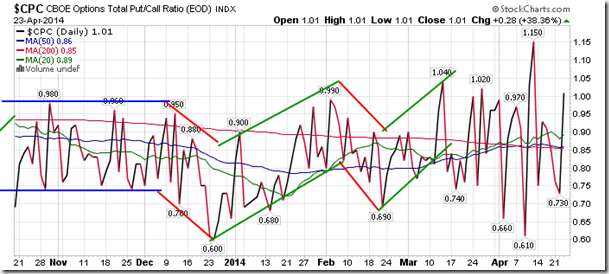
Sentiment on Wednesday, as gauged by the put-call ratio, ended bearish at 1.01. The wild swings in the ratio continue, suggesting ongoing indecision amongst investors.
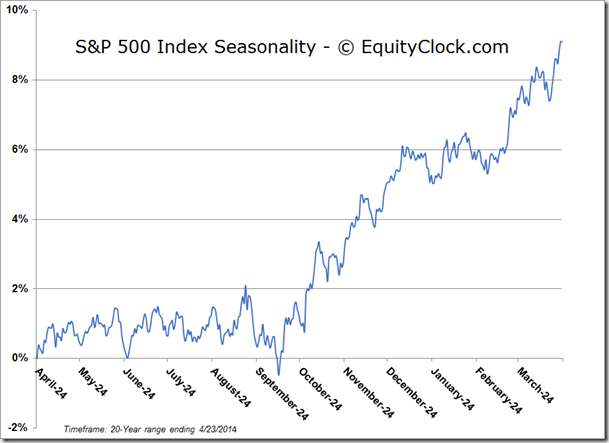
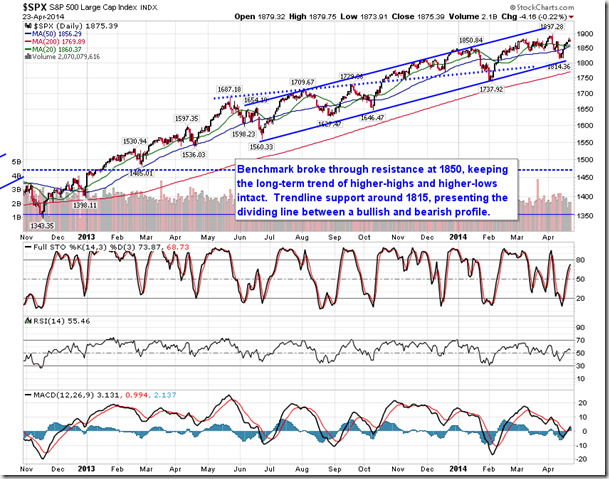
S&P 500 Index
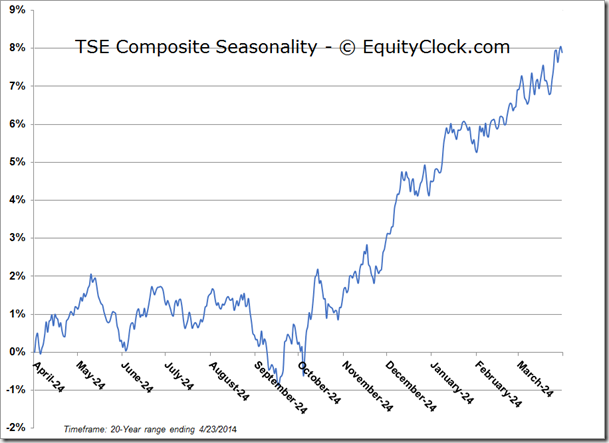
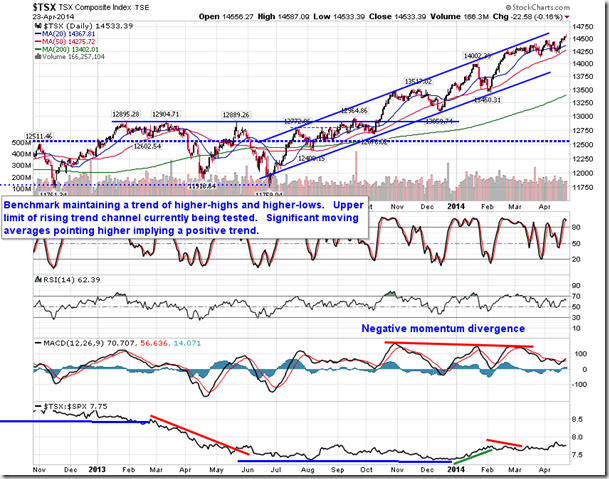
TSE Composite
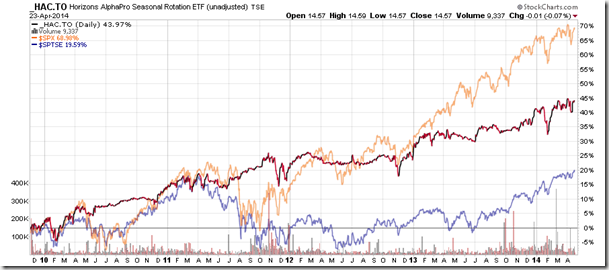
Horizons Seasonal Rotation ETF (TSX:HAC)
- Closing Market Value: $14.57 (down 0.07%)
- Closing NAV/Unit: $14.58 (down 0.07%)
Performance*
| 2014 Year-to-Date | Since Inception (Nov 19, 2009) | |
| HAC.TO | 1.96% | 45.8% |
* performance calculated on Closing NAV/Unit as provided by custodian
