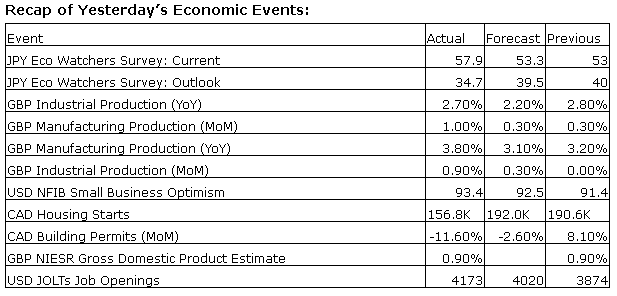
Upcoming US Events for Today:- Wholesale Trade for February will be released at 10:00am. The market expects a month-over-month increase of 0.6%, consistent with the previous report.
- Weekly Crude Inventories will be released at 10:30am.
- FOMC Minutes will be released at 2:00pm.
Upcoming International Events for Today:
- German Trade Balance for February will be released at 2:00am EST. The market expects €17.8B versus €17.2B previous.
- Great Britain Total Trade balance for February will be released at 4:30am EST. The market expects -£9.2B versus -£9.8B previous.
- Japan Machine Orders for February will be released at 7:50pm EST. The market expects a year-over-year increase of 17.5% versus an increase of 23.6% previous.
- China New Yuan Loans for March will be released at 8:01pm EST. The market expects ¥1000B versus ¥644.5B previous.
- Australia Unemployment Rate for March will be released at 9:30pm EST. The market expects 6.1% versus 6.0% previous.
- China Trade Balance for March will be released at 10:00pm EST. The market expects a surplus of $0.9B versus a deficit of $23B previous. Exports are expected to show a year-over-year increase of 4% versus a decline of 18.1% previous. Imports are expected to show a year-over-year increase of 2.4% versus an increase of 10.1% previous.
The Markets
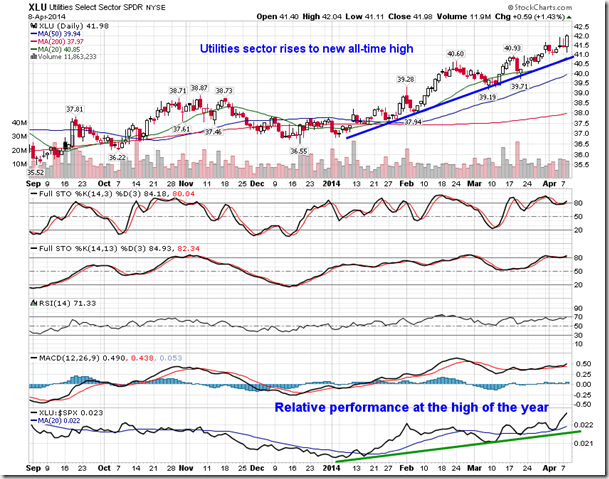
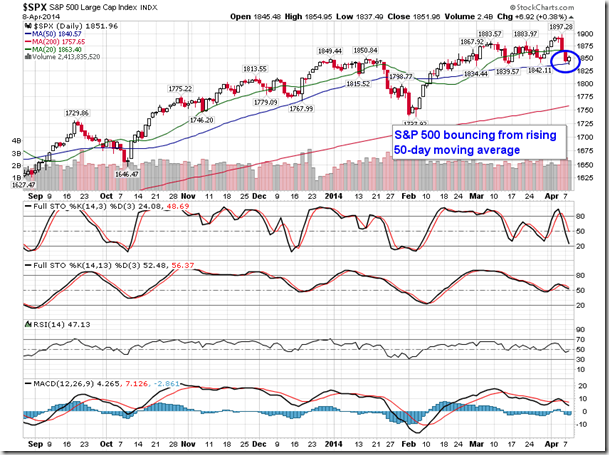
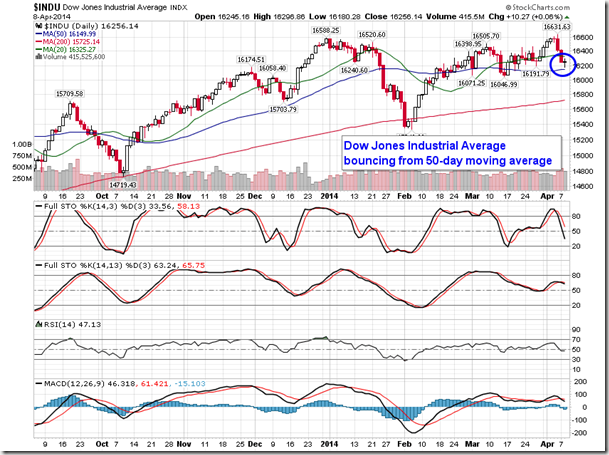
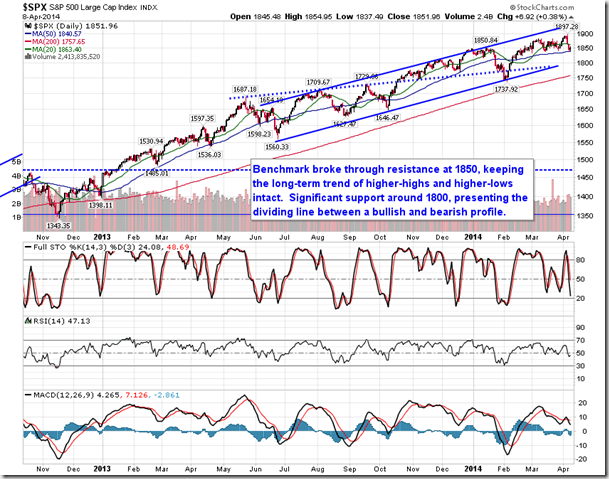
Stocks amounted a slight rebound ahead of the start of earnings season as major benchmarks bounced from short-term oversold levels. The S&P 500 traded higher by a mere 0.38%, bouncing off of its rising 50-day moving average as the benchmark struggles to maintain its positive intermediate trend amidst the increasing weakness in growth stocks. The gain on the Dow Jones Industrial Average was even less, gaining 0.06% on the session, also bouncing from its 50-day moving average. Utilities remains the best performing sector year-to-date as the Utilities ETF (XLU) charts a new all-time high given the risk aversion that has become prominent over the past couple of weeks.
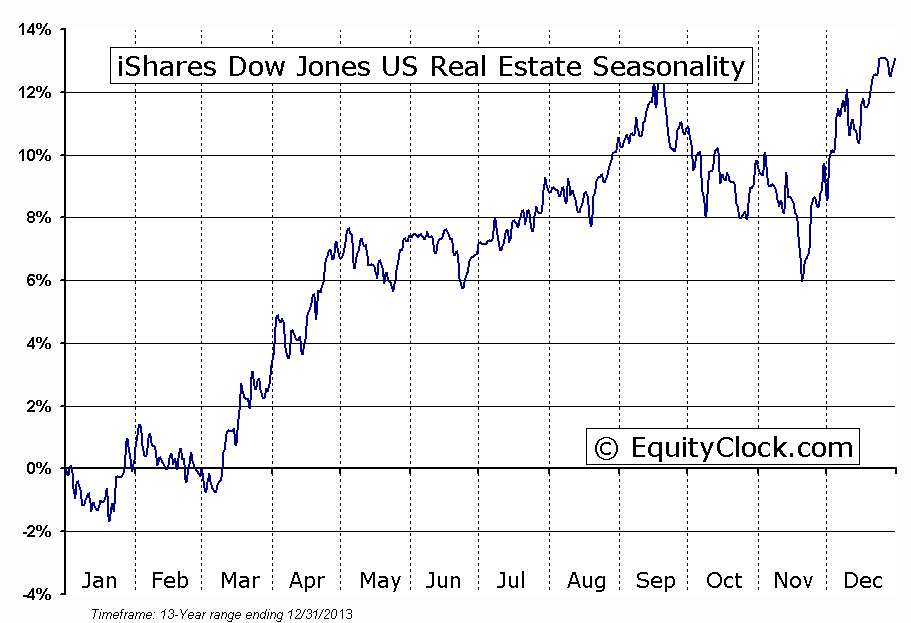
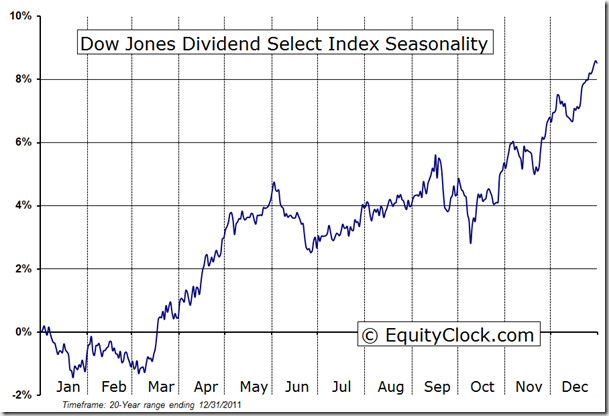
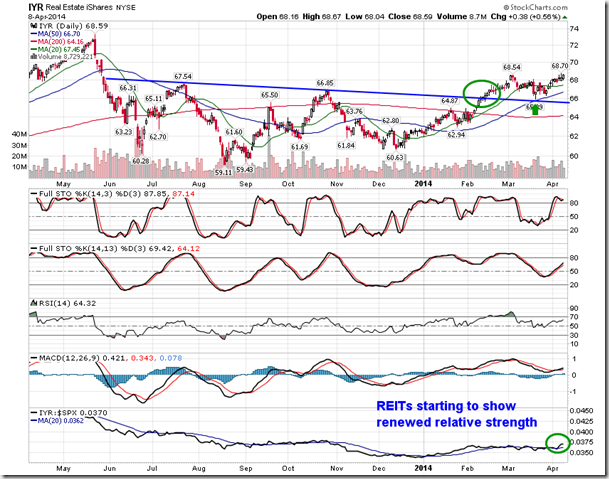
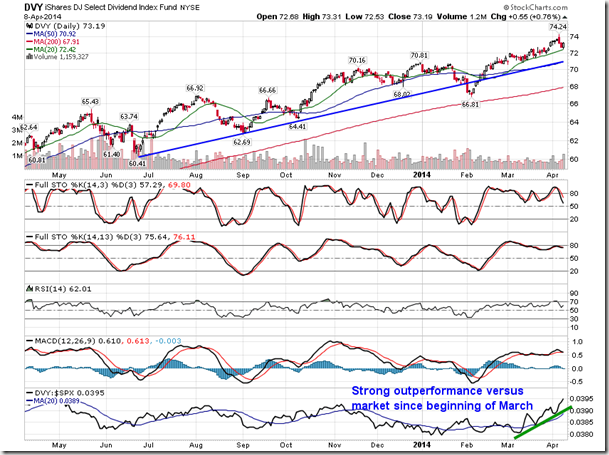
Investors appear to be playing somewhat of a waiting game: waiting to determine the outcome of earnings season for the first quarter; waiting to determine the actions of the Fed; waiting to determine the strength of the economy via upcoming reports. In the meantime, stocks are still in play with investors rotating into defensive areas of the market. Dividend paying stocks and REITs are fulfilling the need, providing some income via distributions during the interim and defending the strong gains achieved over the past 15 of 16 months via low beta positions. The Dow Jones Dividend Select Index Fund (DVY) has been strongly outperforming the broad market since the beginning of March; the iShares US Real Estate ETF is starting to show renewed strength relative to the market after a strong start to the year. Both dividend paying stocks and REITs seasonally outperform the market through to May as investors seek to reduce risk around the first quarter earnings season, ahead of the typical “sell in May” date.
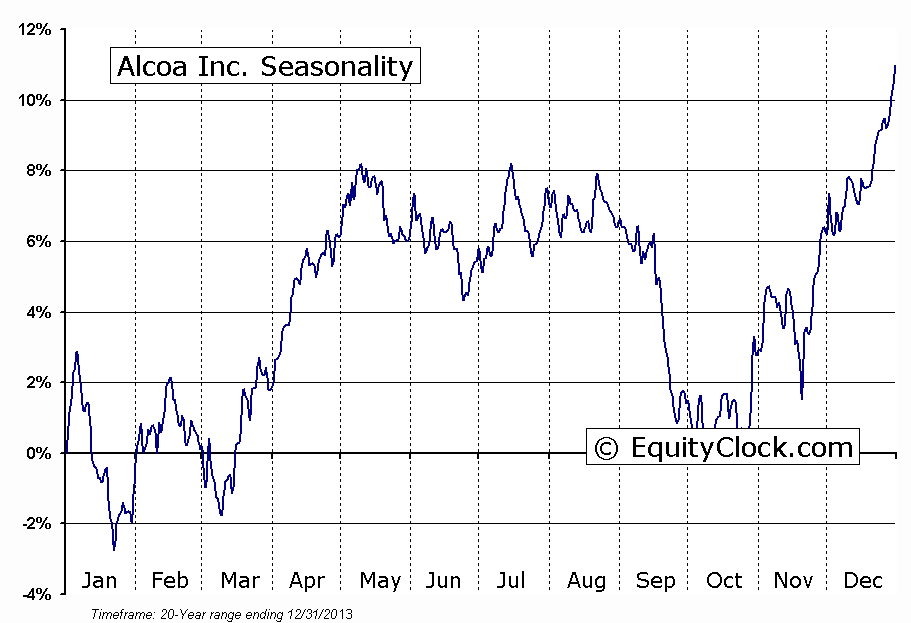
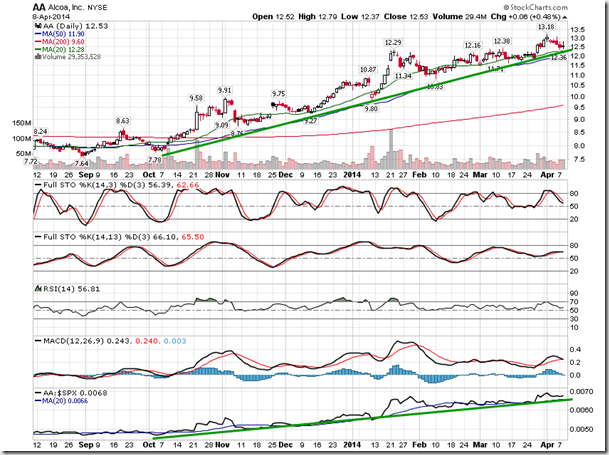
Alcoa kicked of earnings season after the closing bell on Tuesday. Although the company reported a bottom line beat, the top line came in a little light. Excluding restructuring charges, the company earned 9 cents per share, above the 5 cents per share analysts had expected. Lower aluminum prices strained top-line revenue, coming in at $5.45 Billion versus estimates calling for $5.57 Billion. Bottom line beats accompanied by top-line misses have become all too common over recent quarters as companies become accustomed to financially engineering the results, leaving investors to question the underlying fundamentals. Eventually, results can only be engineered so far until the true fundamentals show through. Still, shares were higher by 2.63% in after-hours trading. The stock continues to maintain support around a rising 20-day moving average and outperformance versus the market has remained evident since last fall. Shares of Alcoa continue to trade well below the peak charted prior to the 2008/2009 financial crisis around $40, currently hovering around levels that were common in the late 1990’s. Alcoa remains seasonally strong through to the beginning of May.
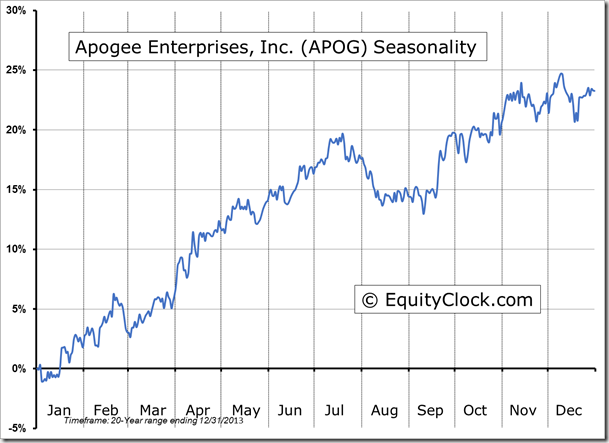
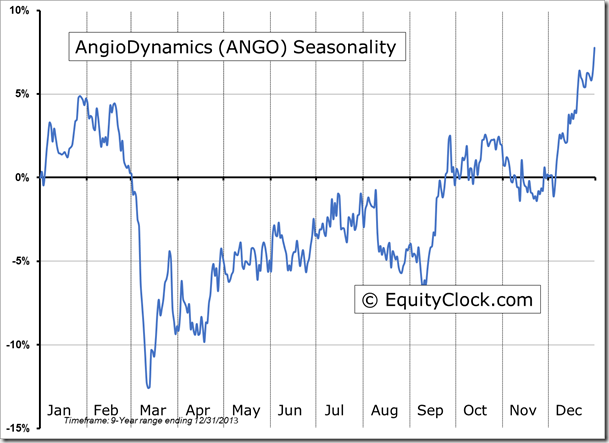
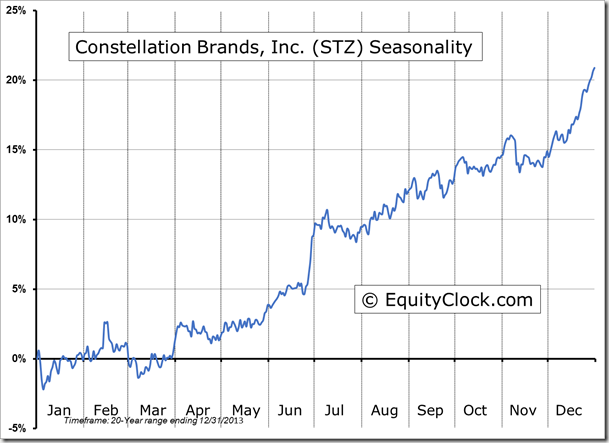
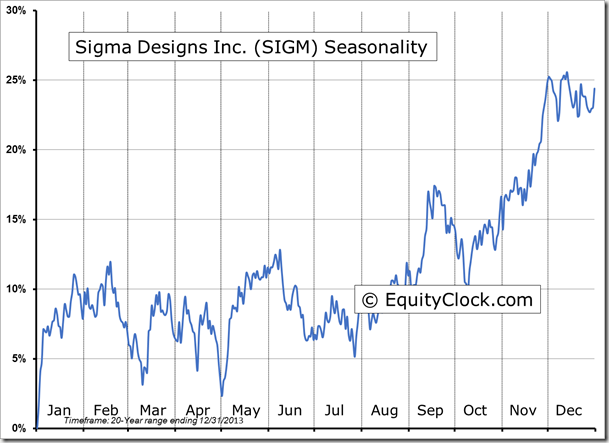
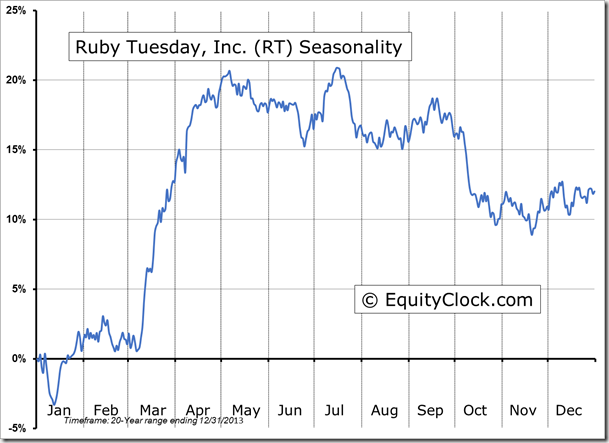
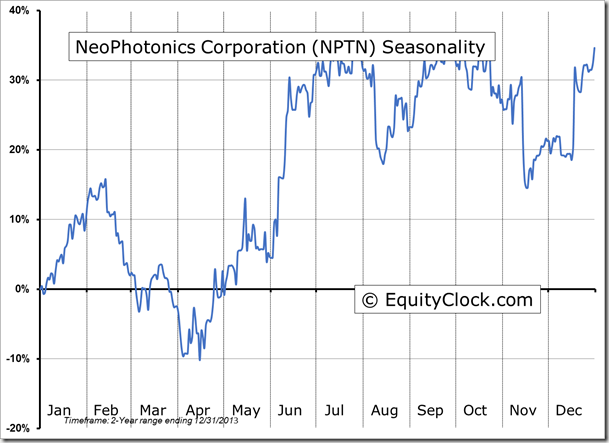
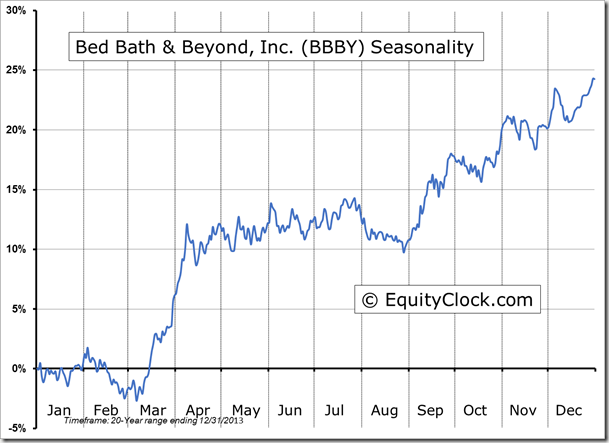
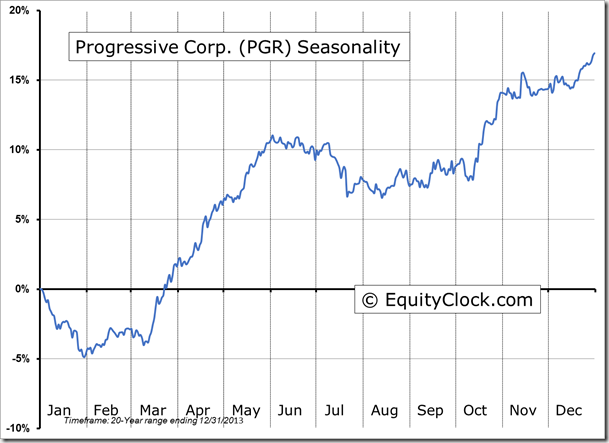
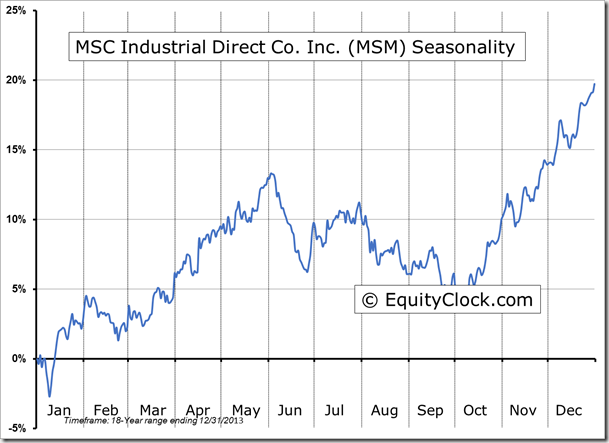
Seasonal charts of companies reporting earnings today:
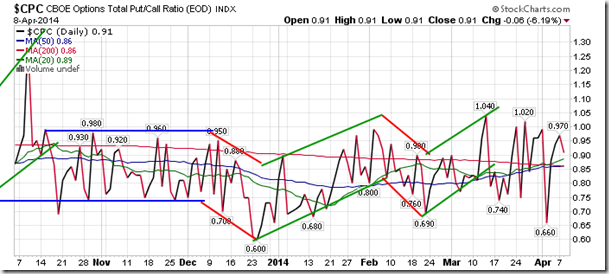
Sentiment on Tuesday, as gauged by the put-call ratio, ended bullish at 0.91.
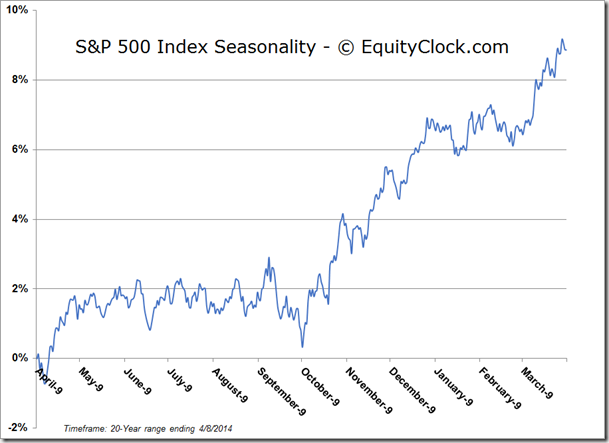
S&P 500 Index
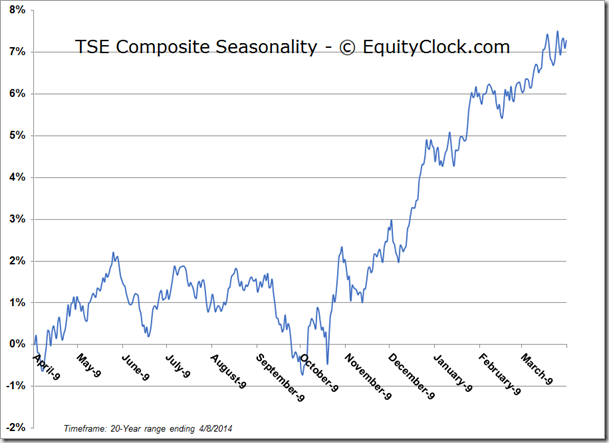
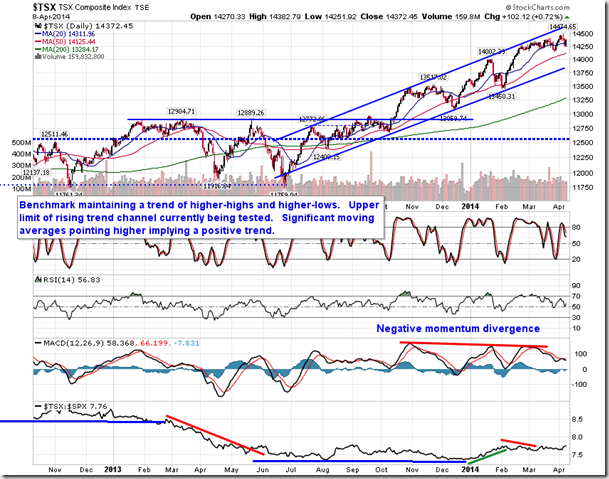
TSE Composite
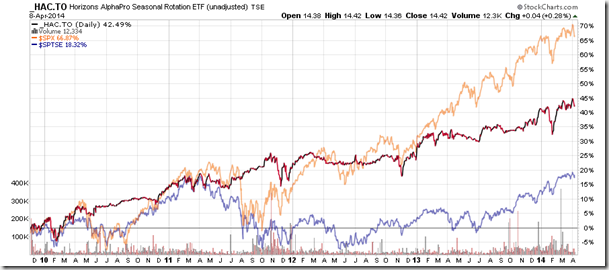
Horizons Seasonal Rotation ETF (TSX:HAC)
- Closing Market Value: $14.42 (up 0.28%)
- Closing NAV/Unit: $14.41 (up 0.42%)
Performance*
| 2014 Year-to-Date | Since Inception (Nov 19, 2009) | |
| HAC.TO | 0.77% | 44.1% |
* performance calculated on Closing NAV/Unit as provided by custodian