Upcoming US Events for Today:
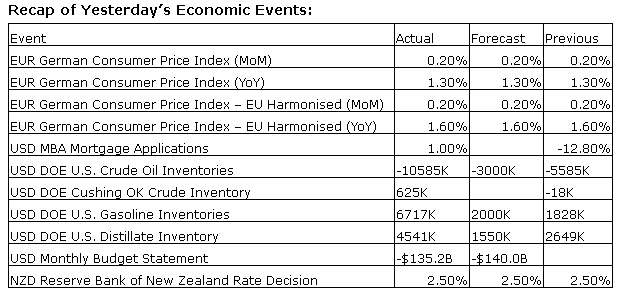
- Weekly Jobless Claims will be released at 8:30am. The market expects Initial Claims to show 325K versus 298K previous.
- Retail Sales for November will be released at 8:30am. The market expects a month-over-month increase of 0.6% versus an increase of 0.4% previous. Less Autos and Gas, sales are expected to increase by 0.2% versus an increase of 0.3% previous.
- Import/Export Prices for November will be released at 8:30am.
- Business Inventories for October will be released at 10:00am. The market expects a month-over-month increase of 0.3% versus an increase of 0.6% previous.
Upcoming International Events for Today:
- The ECB publishes its monthly report at 4:00am EST.
- Euro-Zone Industrial Production for October will be released at 5:00am EST. The market expects a year-over-year increase of 1.1%, consistent with the previous report.
The Markets
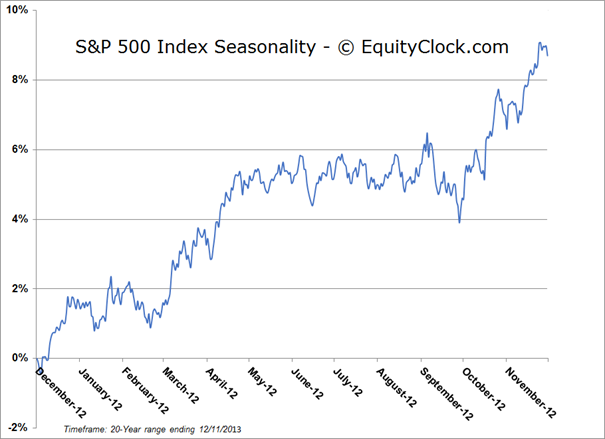
Stocks traded sharply lower on Wednesday as taper concerns weighed upon investor sentiment. Risk aversion dominated session activity as most cyclical sectors lost 1% or more; the defensive consumer staples was the only sector to post gains on the day. With a bipartisan budget deal amongst congressional leaders and improving economic data, investors are perceiving a taper event to be more likely than not when the FOMC meets next week. Investors may be willing to close the books on equity market funds early in order to avoid the uncertain outcome next week. Seasonal tendencies continue to favour the last half of the month, implying that any weakness presented into next week may provide ideal buying opportunities for the Santa Claus Rally ahead.
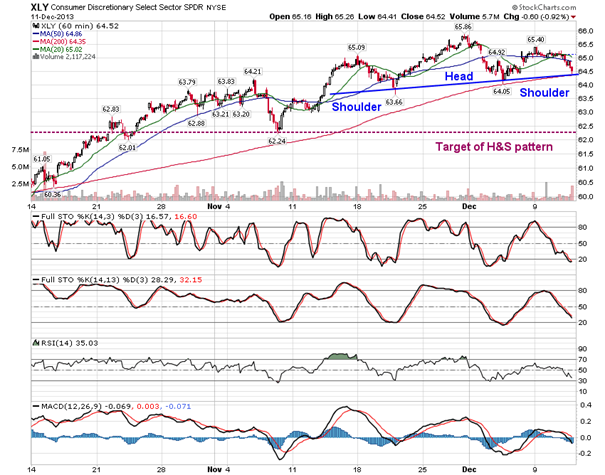
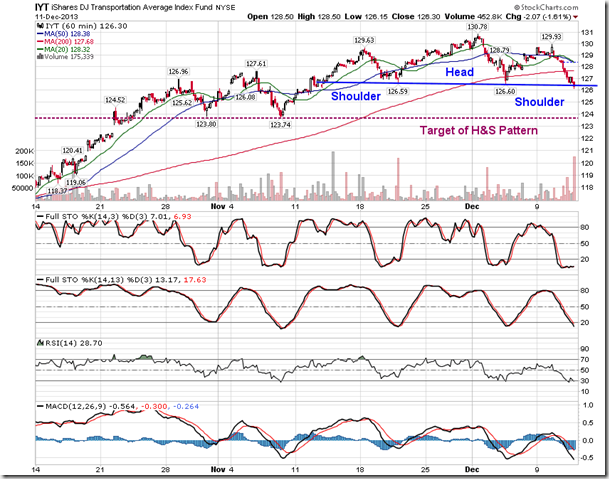
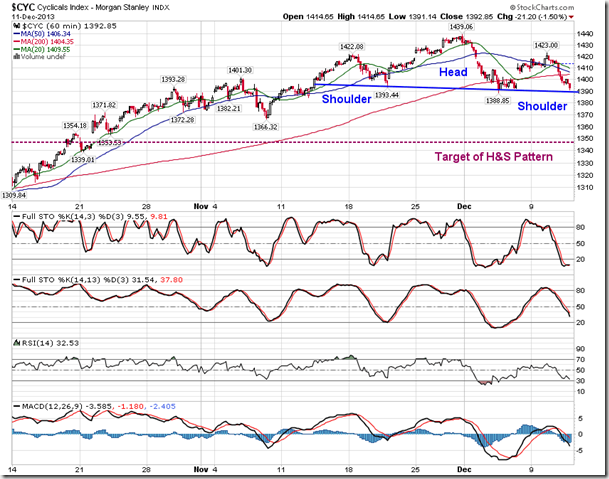
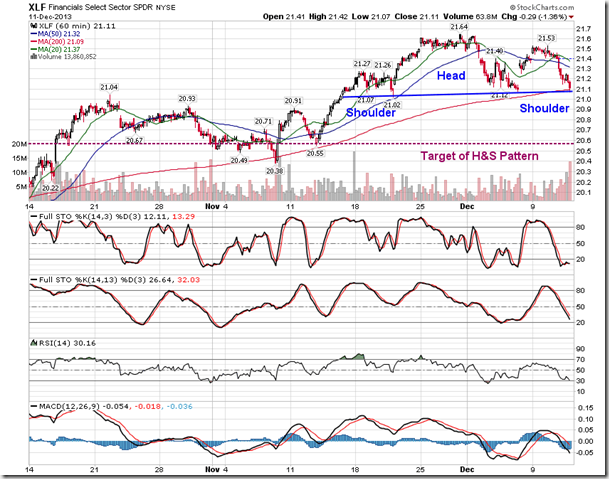
As pointed out in yesterday’s report, the hourly chart of the S&P 500 was showing indications of a lower-high. This comes after a prolonged trend of higher-highs and higher-lows that characterized the bull market run. A short-term topping setup presented by a head-and-shoulders pattern is now becoming apparent. The neckline of the pattern is evident at 1775. However, until this level is broken, it merely represents support. Target upon breakdown below the neckline points to around 1743, or 2.2% below present levels. The long-term trend, beyond the short-term negative setup, remains positive, defined by higher-highs and higher-lows. This is unlikely to change before the year ends.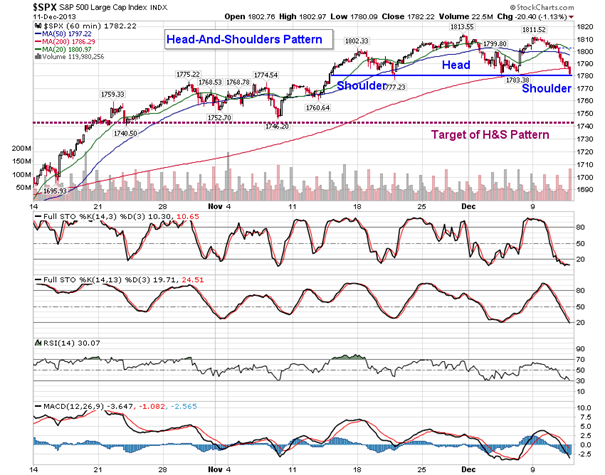
Other charts are showing similar bearish head-and-shoulders setups. The Industrial Sector ETF (XLI), Discretionary Sector ETF (XLY), Transportation Average ETF (IYT), Financial Sector ETF (XLF), and Morgan Stanley Cyclical Index all suggest targets 2% to 4% below present levels should support break at the neckline of these topping patterns. Moves are likely to be swift, leading directly into a strong period for equities at the end of this month.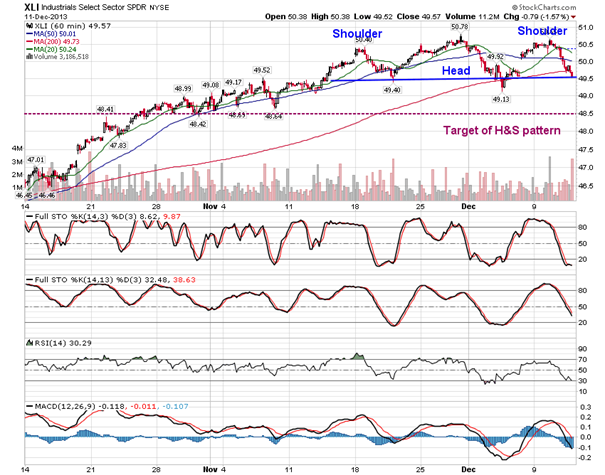
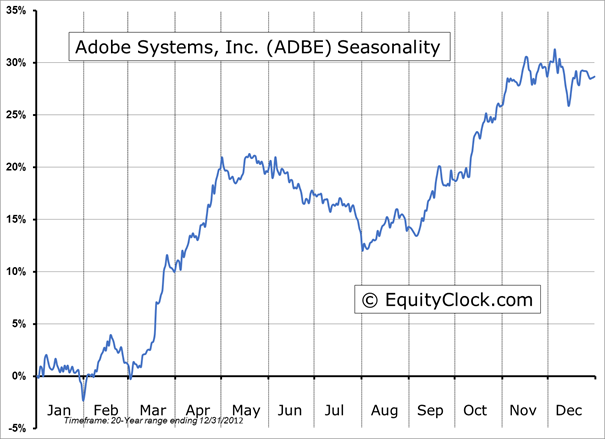
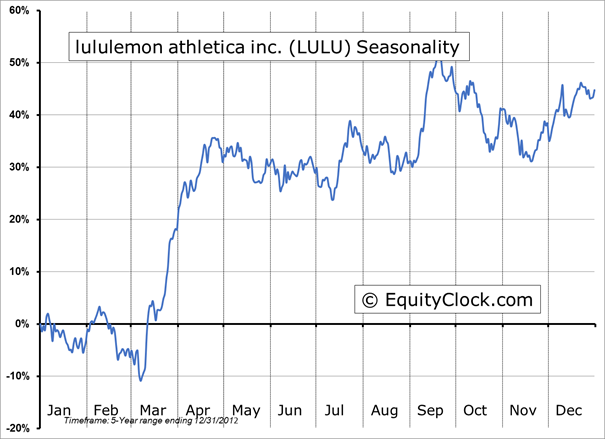
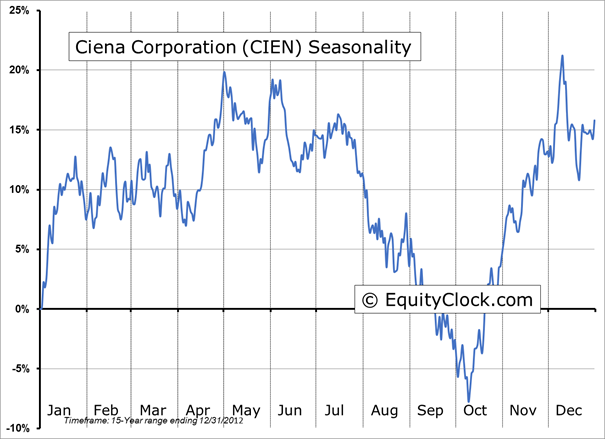
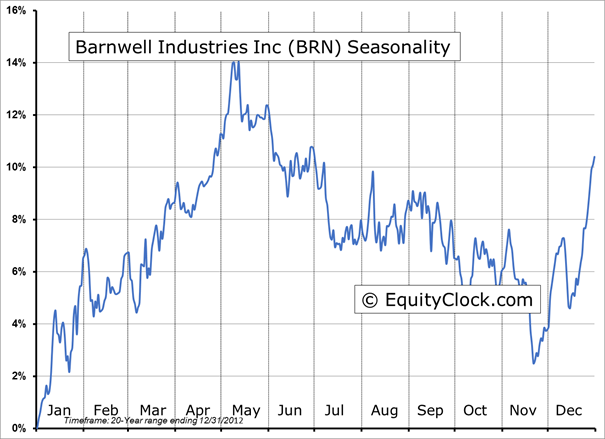
Seasonal charts of companies reporting earnings today: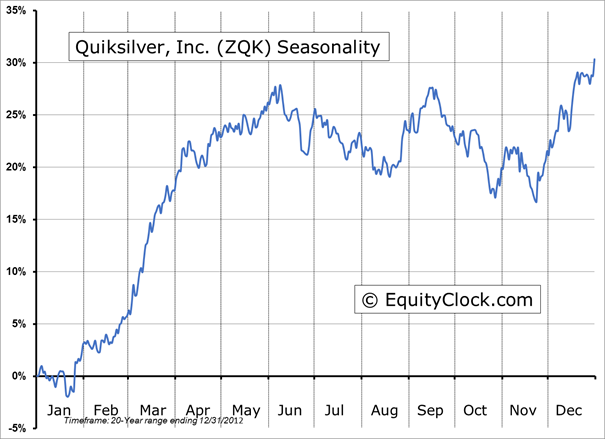
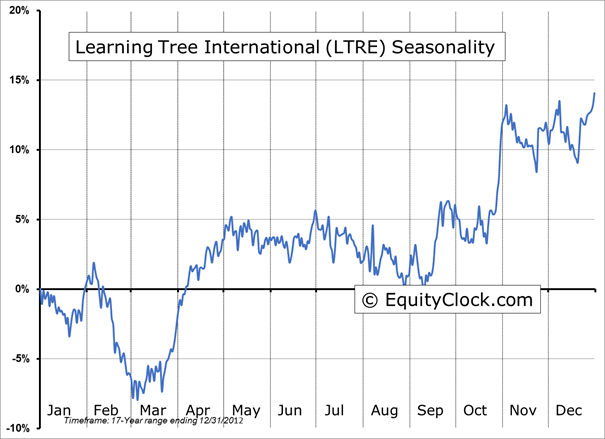
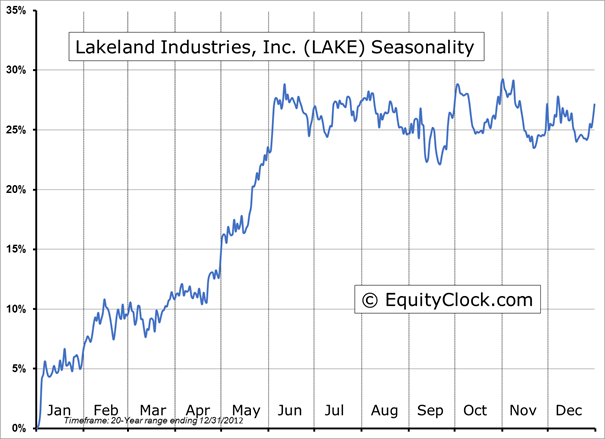
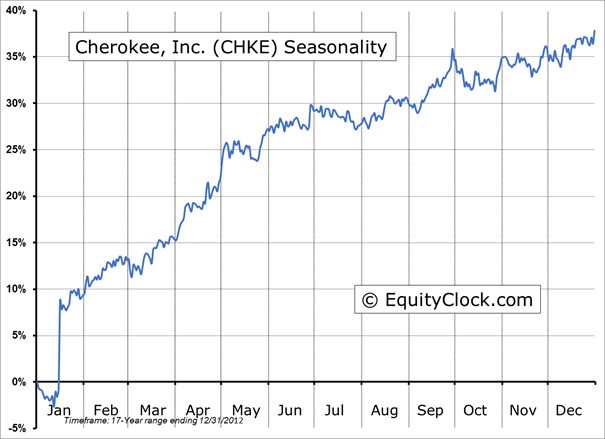
Sentiment on Wednesday, as gauged by the put-call ratio, ended bullish at 0.95.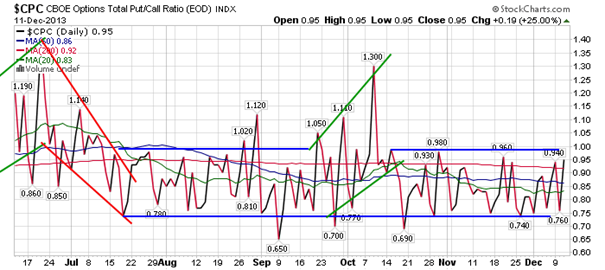
S&P 500 Index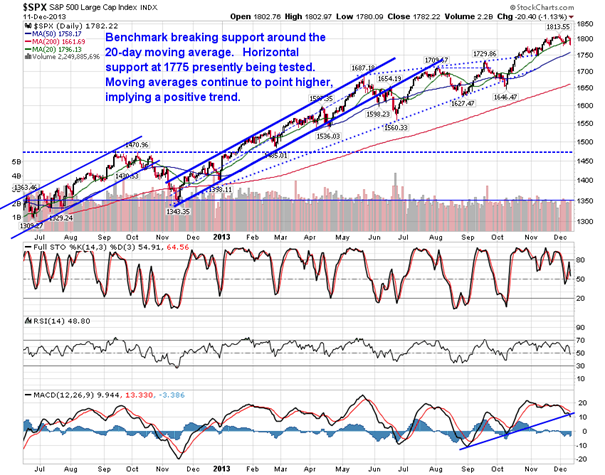
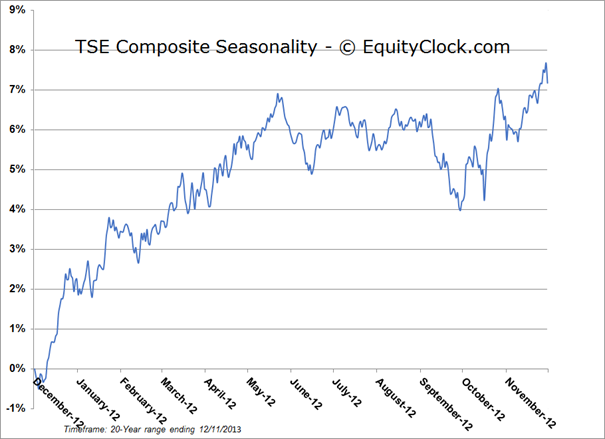
TSE Composite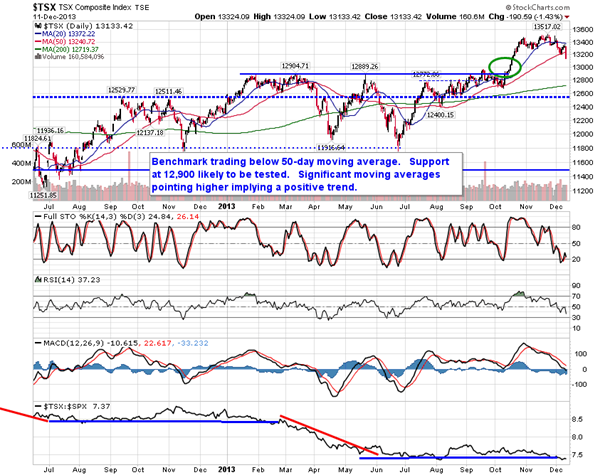
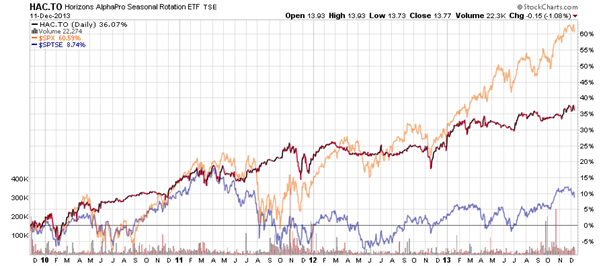
Horizons Seasonal Rotation ETF (TSX:HAC)
- Closing Market Value: $13.77 (down 1.08%)
- Closing NAV/Unit: $13.75 (down 1.28%)
Performance*
* performance calculated on Closing NAV/Unit as provided by custodian 