Upcoming US Events for Today:
- Chicago Fed National Activity Index for July will be released at 8:30am. The market expects 0.20 versus 0.12 previous.
- PMI Flash Services for August will be released at 9:45am. The market expects 62.0 versus 61.0 previous previous.
- New Home Sales for July will be released at 10:00am. The market expects 430K versus 406K previous.
- Dallas Fed Manufacturing Survey for August will be released at 10:30am. The market expects 13.5 versus 12.7 previous.
Upcoming International Events for Today:
- German IFO Survey for August will be released at 4:00am EST. The market expects Economic Sentiment to show 107.0 versus 108.0 previous. Current Conditions is expected to show 111.8 versus 112.9 previous. Business Expectations is expected to show 102.2 versus 103.4 previous.
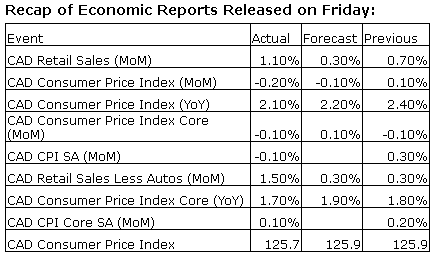
The Markets
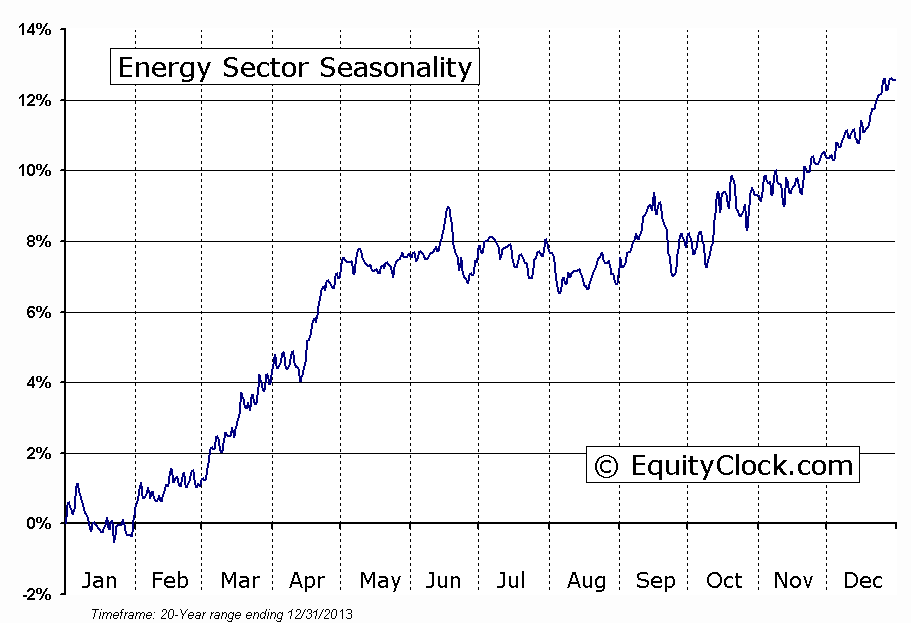
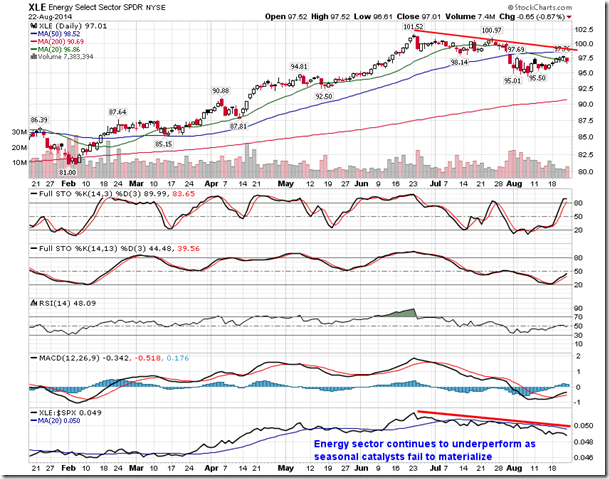
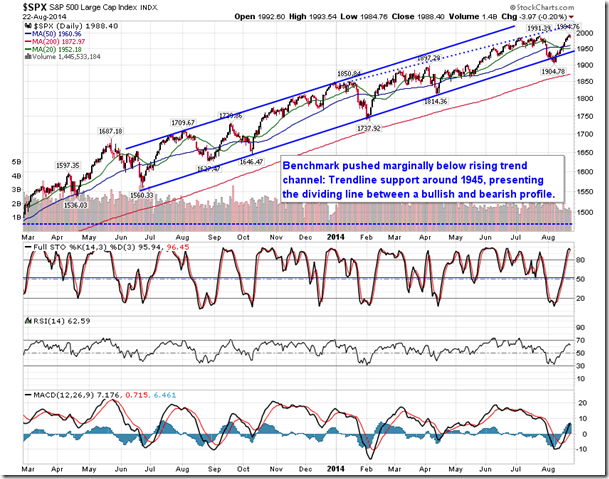
Stocks wavered around all-time highs on Friday as investors listened for clues pertaining to monetary policy from Fed Chair Janet Yellen. Consensus remains that the first rate hike will occur sometime in the first half of 2015, however, an increase earlier in 2015 cannot be ruled out as Fed officials debate the strength of the labour market. Losses on the session were led by energy stocks, which continue to suffer from the decline in the price of Oil, which has now lost over 13% since peaking in June. The Energy sector continues to show signs of underperformance versus the market, despite the fact that the average seasonal start date of the second leg in its period of seasonal strength has now passed; energy stocks typically climb during the late summer period, through the Labour Day long weekend, as the summer driving season comes to an end. The peak of hurricane season from late August through September also acts as an important catalyst, but thus far the threat of these severe weather events has been limited. The National Oceanic and Atmospheric Administration (NOAA) indicated in its recent report that it expected a 70% chance of a below-normal season as “atmospheric conditions are not favorable for storm development.” With the seasonal catalyst proving to be non-existent, the strength in the energy sector may not materialize according to historical averages. The price of Crude Oil continues to hover around oversold levels, yet, support remains below present levels around $91.50. The SPDR S&P Intl Energy Sector (NYSE:IPW) ETF remains in a short-term declining trend, as indicated by the direction of the 20-day moving average; resistance is apparent around $98.
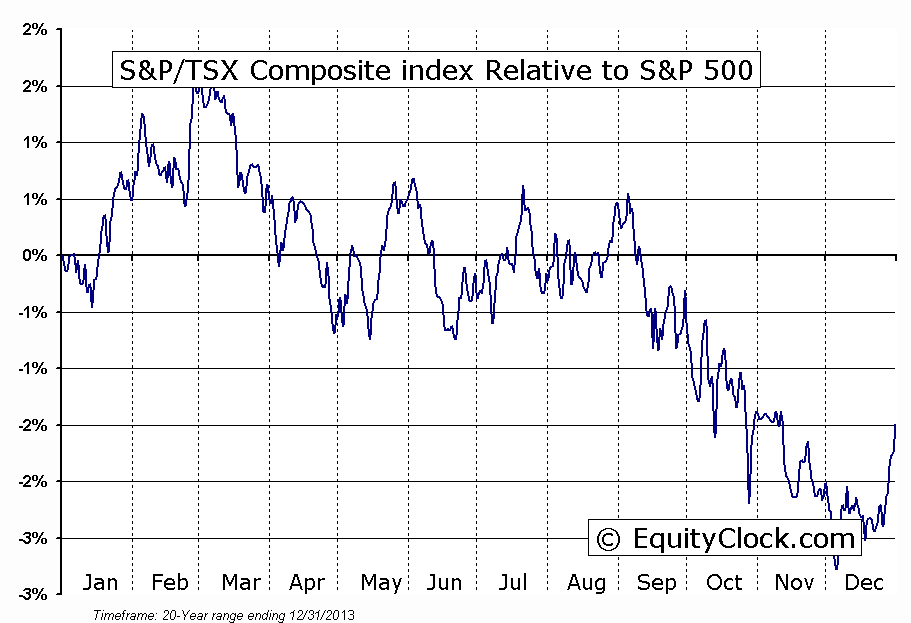
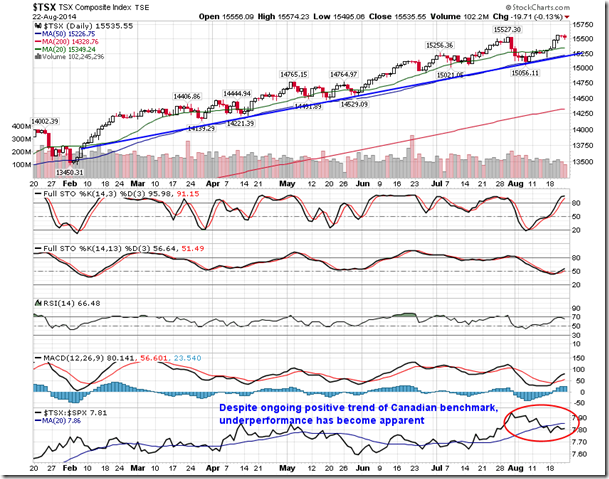
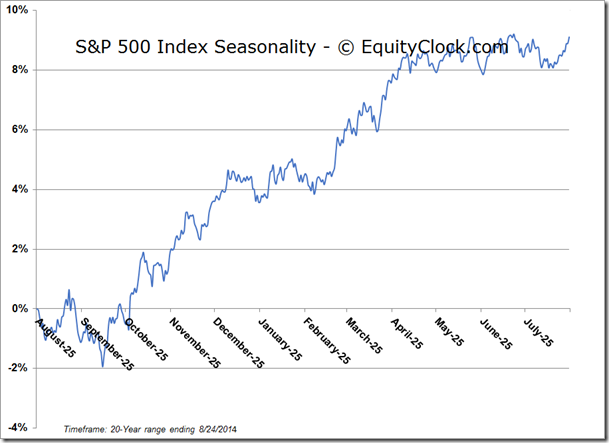
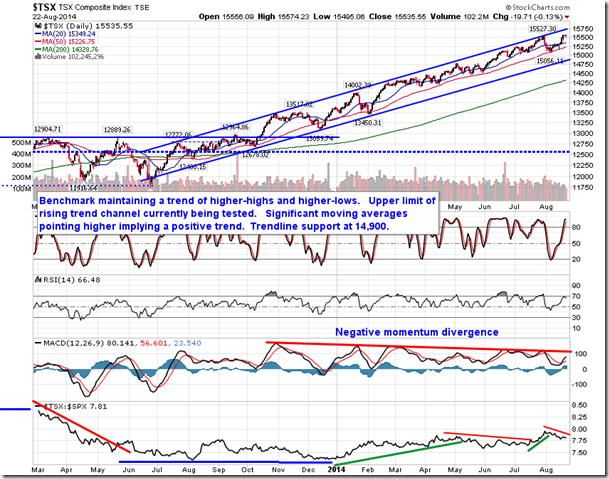
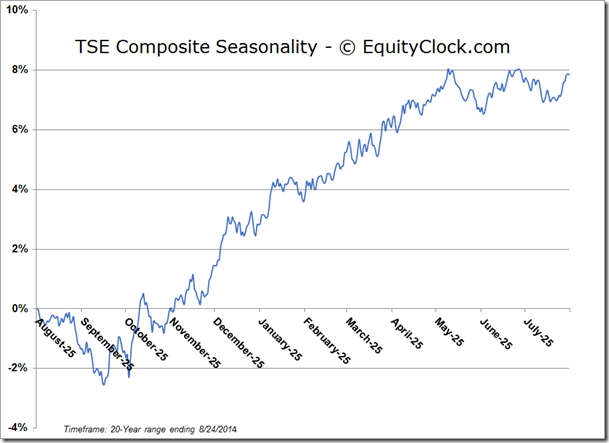
Despite seasonal strength in Energy and Gold stocks into the month of September, history shows that the TSX Composite, which has a significant weight in each of these sectors, has underperformed the US market (S&P 500), on average, from the beginning of September through to December. The trend of the Canadian benchmark continues to be positive, however, underperformance versus the S&P 500 has recently become apparent as commodity prices struggle. The last few months of the year tend to be dominated by stocks that benefit from end of year business and consumer spending, such as consumer discretionary and technology. With the TSX composite holding an insignificant weighting in these sectors, outperformance in US benchmark is typically realized.
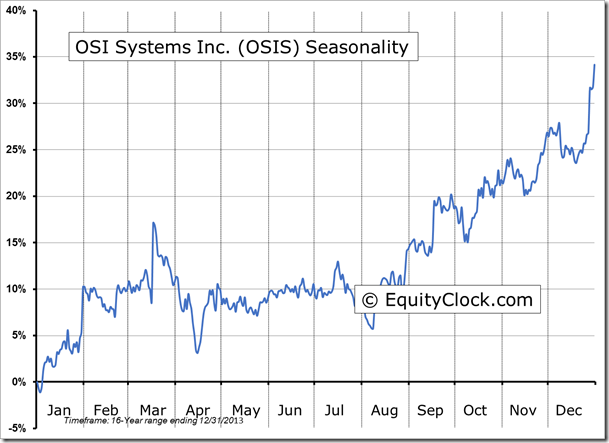
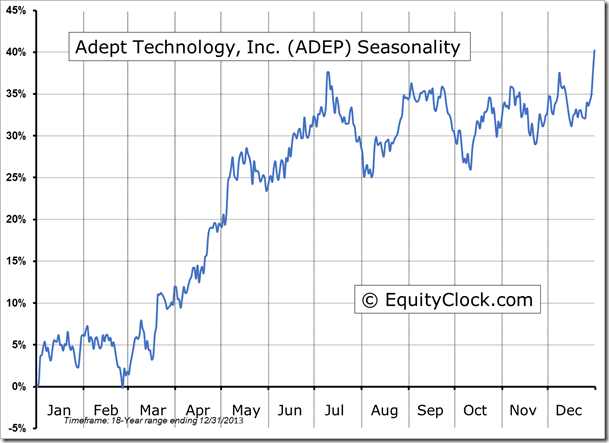
Seasonal charts of companies reporting earnings today:
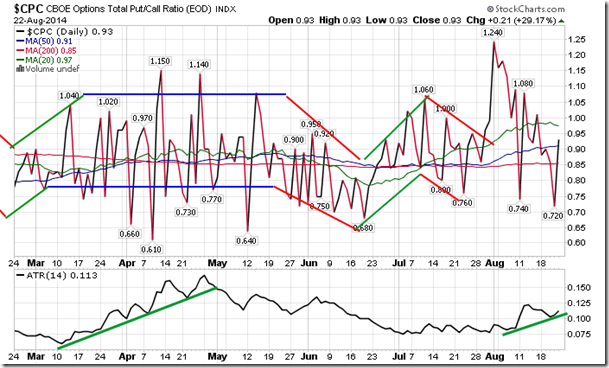
Sentiment on Friday, as gauged by the put-call ratio, ended bullish at 0.93. Despite the decline in bearish sentiment, a rise in the average true range of the put-call ratio has been apparent over recent weeks as investors race back and forth between bullish and bearish option positioning, suggesting instability in equity markets. It has yet to be seen whether this instability will translate into equity market weakness or the return to the bullish stability that was apparent in June and July.
S&P 500 Index
TSE Composite
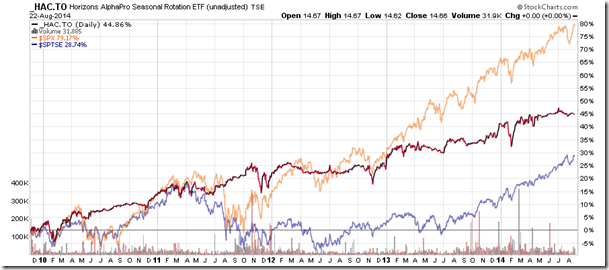
Horizons Seasonal Rotation ETF (TO:HAC)
- Closing Market Value: $14.66 (unchanged)
- Closing NAV/Unit: $14.64 (down 0.04%)
Performance*
| 2014 Year-to-Date | Since Inception (Nov 19, 2009) | |
| HAC.TO | 2.38% | 46.4% |
* performance calculated on Closing NAV/Unit as provided by custodian
Click Here to learn more about the proprietary, seasonal rotation investment strategy developed by research analysts Don Vialoux, Brooke Thackray, and Jon Vialoux.
