
Upcoming US Events for Today:
- Job Openings and Labor Turnover Survey for August will be released at 10:00am. The market expects 4.710M versus 4.673M previous.
- Consumer Credit for August will be released at 3:00pm. The market expects $20.0B versus $26.0B previous.
Upcoming International Events for Today:
- German Industrial Production for August will be released at 2:00am EST. The market expects a year-over-year decline of 0.3% versus an increase of 2.4% previous.
- Great Britain Industrial Production for August will be released at 4:30am EST. The market expects a year-over-year increase of 2.6% versus an increase of 1.7% previous.
- China HSBC Services PMI for September will be released at 9:45pm EST.

**NEW** As part of the ongoing process to offer new and up-to-date information regarding seasonal and technical investing, we are adding a section to the daily reports that details the stocks that are entering their period of seasonal strength, based on average historical start dates. Stocks highlighted are for information purposes only and should not be considered as advice to purchase or to sell mentioned securities. As always, the use of technical and fundamental analysis is encouraged in order to fine tune entry and exit points to average seasonal trends.
Stocks Entering Period of Seasonal Strength Today:
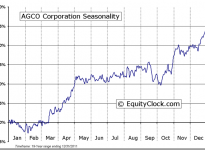
AGCO Corporation (NYSE:AGCO) Seasonal Chart
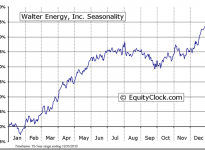
Walter Energy, Inc. (NYSE:WLT) Seasonal Chart
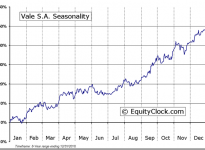
Vale (ADR) (NYSE:VALE) Seasonal Chart
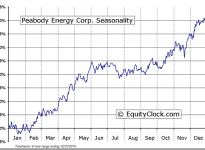
Peabody Energy Corporation (NYSE:BTU) Seasonal Chart
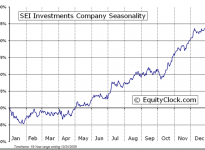
SEI Investments Company (NASDAQ:SEIC) Seasonal Chart
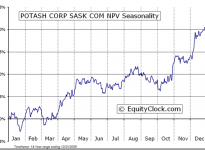
Potash Corp./Saskatchewan Inc. (NYSE:POT) Seasonal Chart
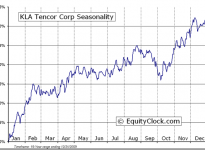
KLA-Tencor Corporation (NASDAQ:KLAC) Seasonal Chart
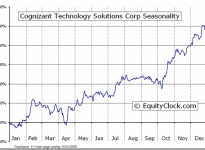
Cognizant Technology Solutions Corp. (NASDAQ:CTSH) Seasonal Chart
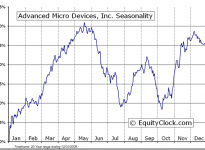
Advanced Micro Devices, Inc. (NYSE:AMD) Seasonal Chart
The Markets
Stocks ended lower on Monday as the strength that followed Friday’s employment report failed to carry through to the new week. The S&P 500 Index attempted to overcome resistance at its 50-day moving average, currently around 1974, but early morning strength was met with selling pressures as investors sought to neutralize portfolios ahead of earnings season. A stronger US Dollar, weak European economy, and general headline risks threaten the forward guidance that many companies may provide this earnings season, the impact of which may lead to more stocks selling on news this season than rallying higher. The 50-day moving average for the S&P 500 essentially a neutral level, therefore reaction over the days ahead could be critical for the equity market trend for the remainder of the month; a break above the 50-day moving average could trigger renewed buy signals, while continued declines below this significant average increases the odds that the long awaited correction of 10% or more will come to fruition. Support for the large-cap benchmark remains around the 125-day moving average.

A drop in the US Dollar on Monday helped to fuel the early morning weakness in the equity market and it also helped to fuel a rebound in the commodity market. The price of gold, silver, platinum, copper, gasoline, and agricultural commodities all jumped by over 1%, attempting to rebound from deeply oversold levels. Among the agricultural commodities that posted strong gains on the day was Soybeans, which is just entering its period of seasonal strength. The price of Soybeans seasonally gains an average of over 18% between now and July, rebounding from a low that coincides with harvest season. The commodity is coming off of a seasonally weak period that spans the third quarter, the performance of which far exceeded seasonal norms this year. A bumper crop significantly boosted the supply of grains, leading to a plunge in the price of soybeans by over 35% in just the past three months. Soybean prices are attempting to rebound from oversold levels as long-term support at $9.00 a bushel is tested. A retracement back to the 50-day moving average, around $11 a bushel, is easily attainable, representing a gain of 15% from present levels.

 Seasonal Chart")
The start of the harvest season also triggers the start of the period of seasonal strength for a number of agricultural stocks, such as AGCO (AGCO), Potash (POT), and Deere (DE). Agricultural related equities have been beaten up this summer, suffering from the impact of plunging grain prices and the rising US Dollar. The stocks recently became significantly oversold, however, momentum divergences over the past couple of months are providing evidence that the stocks are attempting to bottom around present levels. Shares of AGCO very recently started to outperform the market, while Deere has been outperforming the market for almost a month. Once the broad equity market weakness concludes, agricultural stocks may finally be ready to run, benefitting from the positive seasonal tendencies that persist through to the end of the year.

 Seasonal Chart")

 Seasonal Chart")
Beat up equally as bad as some of the agricultural stocks have been coal stocks, which plunged by over 13% just last month, according to the Market Vectors Coal ETF (ARCA:KOL). KOL is now deeply oversold and testing long-term support around $16.75. Peabody Energy (NYSE:BTU) and Walter Energy (NYSE:WLT), two notable coal producers, are entering their period of seasonal strength, which runs through the end of the year. Shares of BTU and WLT are substantially oversold and the long-term trend remains firmly negative, however, a bounce from present levels during the period of seasonal strength ahead is becoming increasingly probable. Both coal stocks average a gain of around 15% between now and the end of the year.


Seasonal charts of companies reporting earnings today:


Sentiment on Monday, as gauged by the put-call ratio, ended neutral at 0.99.

S&P 500 Index


TSE Composite


Horizons Seasonal Rotation ETF (TO:HAC)
- Closing Market Value: $14.35 (down 0.35%)
- Closing NAV/Unit: $14.37 (down 0.27%)
Performance*
| 2014 Year-to-Date | Since Inception (Nov 19, 2009) | |
| HAC.TO | 0.49% | 43.7% |
* performance calculated on Closing NAV/Unit as provided by custodian
