
**NEW** As part of the ongoing process to offer new and up-to-date information regarding seasonal and technical investing, we are adding a section to the daily reports that details the stocks that are entering their period of seasonal strength, based on average historical start dates. Stocks highlighted are for information purposes only and should not be considered as advice to purchase or to sell mentioned securities. As always, the use of technical and fundamental analysis is encouraged in order to fine tune entry and exit points to average seasonal trends.
Stocks Entering Period of Seasonal Strength Today:
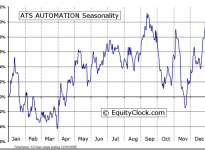
ATS Automation Tooling Systems Inc. (TO:ATA) Seasonal Chart
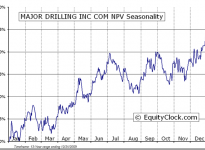
Major Drilling Group Int’l Inc. (TO:MDI) Seasonal Chart
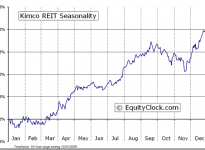
Kimco Realty Corporation (NYSE:KIM) Seasonal Chart
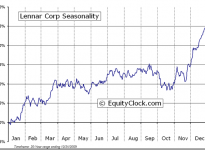
Lennar Corporation (NYSE:LEN) Seasonal Chart
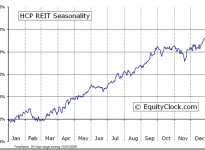
HCP, Inc. (NYSE:HCP) Seasonal Chart
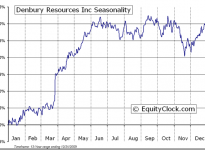
Denbury Resources Inc. (NYSE:DNR) Seasonal Chart
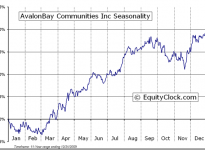
AvalonBay Communities, Inc. (NYSE:AVB) Seasonal Chart
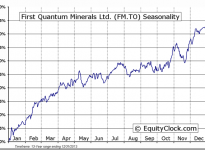
First Quantum Minerals Limited (TO:FM) Seasonal Chart
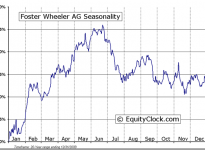
Foster Wheeler Ltd. (NASDAQ:FWLT) Seasonal Chart
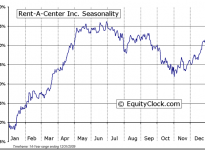
Rent-A-Center, Inc (NASDAQ:RCII) Seasonal Chart
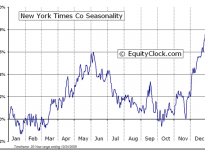
The New York Times Company (NYSE:NYT) Seasonal Chart
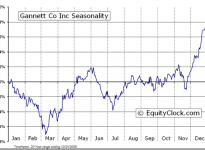
Gannett Co., Inc. (NYSE:GCI) Seasonal Chart
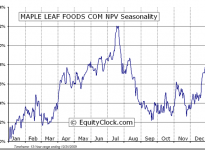
Maple Leaf Foods Inc. (TO:MFI) Seasonal Chart
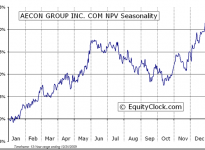
Aecon Group Inc (TO:ARE) Seasonal Chart
The Markets
An unexpected rate cut out of China and hints of stimulus out of Europe were enough to fuel a rally in equity markets around the globe on Friday. The S&P 500 Index and Dow Jones Industrial Average both gained just over half of one percent, charting a fifth straight weekly gain and maintaining an unprecedented climb from the lows charted in October. The S&P 500 Index has now traded above its 5-day moving average for 26 sessions, tied for the longest run above this short-term average in over 60 years. This 5-day moving average, at 2051.62 as of Friday’s close, remains the line of support below this market; clearly, a catalyst is required to initiate a retracement, alleviating the overbought conditions that have become ubiquitous.

With central banks outside of the US maintaining accommodative policies, the US Dollar Index traded to the highest level in over four years, testing the June high of 88.71. This high marks a level of horizontal resistance that has kept a lid on the US currency since 2006, ahead of the accommodative policies implemented by the US Fed during the recent recession. With the US Fed on a path towards tightening, a breakout in the US Dollar through resistance appears inevitable. A move above resistance would complete a long-term basing pattern, suggesting that the strength in the currency index realized since the summer is just the start of a more substantial move in the benchmark that could last for some years. The US Dollar seasonally gains through the first few months of the new year, but, before it enters this period of seasonal strength, it has to get through the weakest month of the year, based on the frequency of losses. Over the past 20 years, the US Dollar Index has declined 70% of the time in the month of December, recording an average loss of 0.80%. Given the significant resistance that remains intact around 89, this may be the opportune time for the benchmark to retrace some of its recent gains, testing levels of support below before continuing higher along its long-term path.

Of course, a stronger dollar is typically a negative for commodities priced in the domestic currency. From November of 1996 through to July of 1999, the approximately 20% rise in the US Dollar index resulted in a loss for the CRB commodity index of approximately 25%, charting the lowest levels in the past 25 years. Just as The US Dollar Index is testing long-term resistance, the CRB commodity index is testing long-term support around 266, a break of which could set the benchmark up to test the 2010 low at around 250, and then the 2009 low around 200. The CRB Commodity Index remains seasonally negative through to mid-December, weighed down by seasonal weakness in energy commodity prices.

Reverting back to the equity market, the strength in benchmarks around the globe on Friday has pushed the German Dax to a pivotal point within its intermediate trend. The benchmark, which is arguably a critical component to the success of the euro-zone, is bumping up against declining trendline resistance within an ongoing megaphone pattern. A breakout from present levels would suggest a conclusion to the downward path that has pressured the benchmark since the start of summer. Much of the same can be said of the MSCI EAFE Index, which has been bound by the same pattern over the past four and a half months. Seasonally, the German Dax is entering into the strongest month of the year, gaining in 85% of Decembers over the past 20 years, resulting in an average gain of 2.7%. The German Dax has started to show signs of outperformance versus the S&P 500 Index, suggesting renewed investor interest.


Sentiment on Friday, as gauged by the put-call ratio, ended bullish at 0.75.

Sectors and Industries entering their period of seasonal strength:
 Seasonal Chart")


Copper is entering its period of seasonal strength, running through to May, gaining 10%, on average, over the period. Although the metal shows mixed tendencies of gains in the last two months of the year, significant lows during this timeframe can often provide appealing entry points for the dominant period of strength through the first few months of the new year. The commodity benefits from a pick-up in manufacturing and industrial production leading into the spring months. Looking at a long-term chart, copper is presently trading within a massive descending triangle pattern, a bearish setup that would become fulfilled upon a break below support, presently at $3.00. Resistance is currently trending lower around $3.15. As the pattern narrows and price action reaches a peak, a break will become evident, providing confirmation of a bullish or bearish move ahead. Shorter-term, the price of Copper is bumping up against resistance at the 50-day moving average, a break of which would conclude an intermediate negative trend that has remained apparent since the summer. Momentum indicators have been trending higher since the start of October, suggesting downside exhaustion. The metal is at a pivotal point, which has just become more interesting with the period of seasonal strength ahead of us.
Seasonal charts of companies reporting earnings today:


S&P 500 Index


TSE Composite


Horizons Seasonal Rotation ETF (TO:HAC)
- Closing Market Value: $15.01 (down 0.07%)
- Closing NAV/Unit: $15.00 (down 0.14%)
Performance*
| 2014 Year-to-Date | Since Inception (Nov 19, 2009) | |
| HAC.TO | 4.90% | 50.0% |
* performance calculated on Closing NAV/Unit as provided by custodian
