Stocks Entering Period of Seasonal Strength Today:No stocks identified for today
No stocks identified for today
The Markets
Stocks recorded a volatile session on Tuesday, ending lower as earnings season gets underway. Stocks initially traded higher following earnings from Alcoa and KB Home, but as the stocks drifted lower, so too did the broad equity market; shares of Alcoa (NYSE:AA) and KB Home (NYSE:KBH) ended lower by 2.29% and 16.29%, respectively.
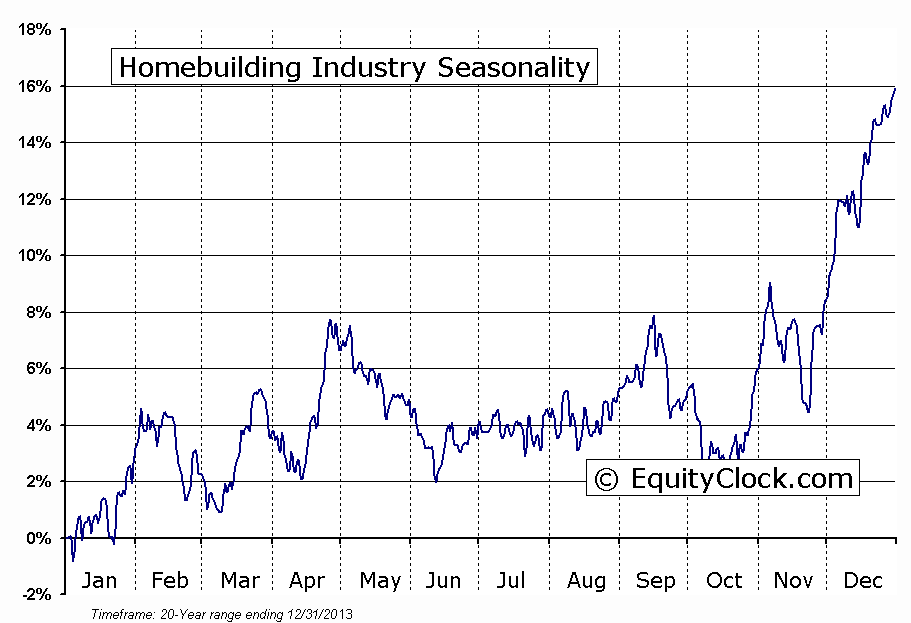
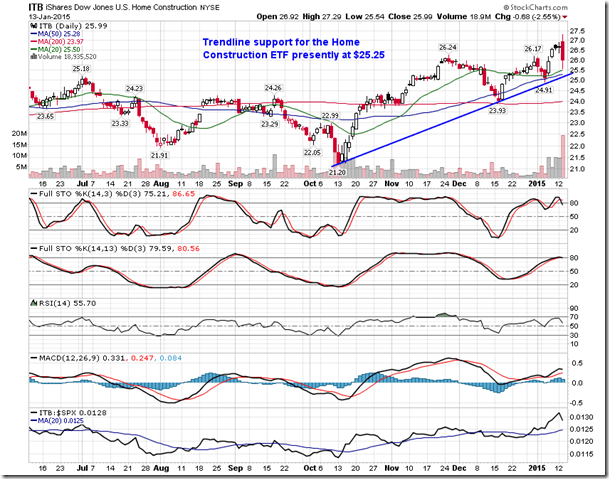
The plunge in shares of KBH, related to margin concerns for the 2015 calendar year, pulled down the entire homebuilding industry, just days after a key breakout in the Dow Jones US Home Construction ETF (NYSE:ITB). The industry ETF charted an outside reversal candlestick, typically an ominous pattern suggesting a significant peak to the previous trend. The ETF is now testing the breakout level at $26 as a level of support.
Seasonally, the homebuilding industry is typically strong through to the start of February, benefiting from the uptick in activity ahead of the spring home buying season. A break of trendline support, currently around $25.25, would present concern that the period of seasonal strength that began in October has come to an end sooner than average.
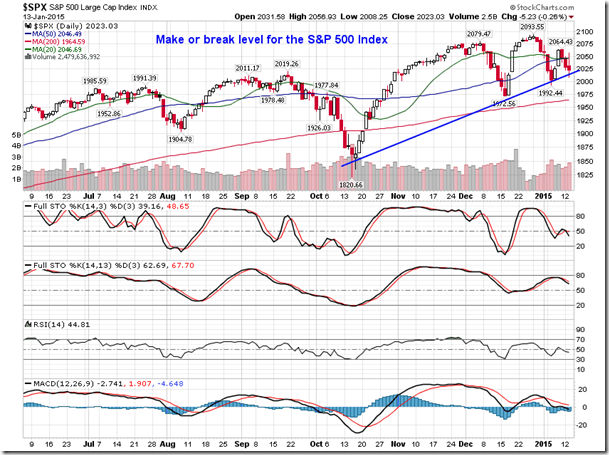
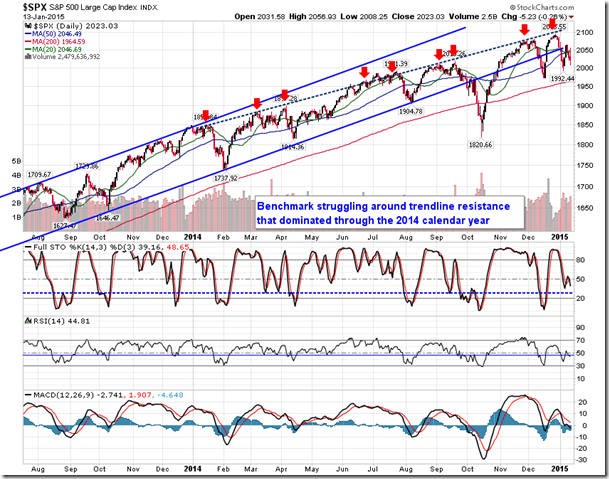
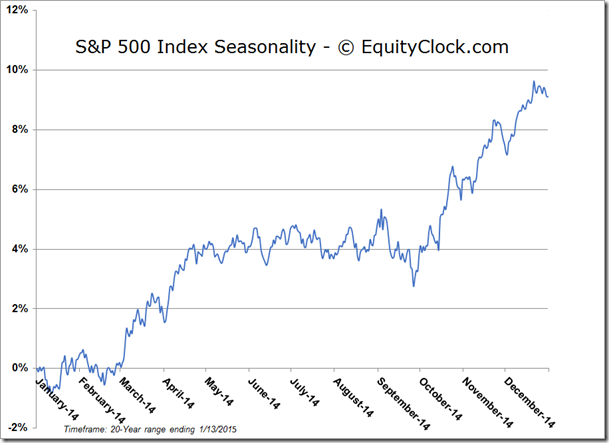
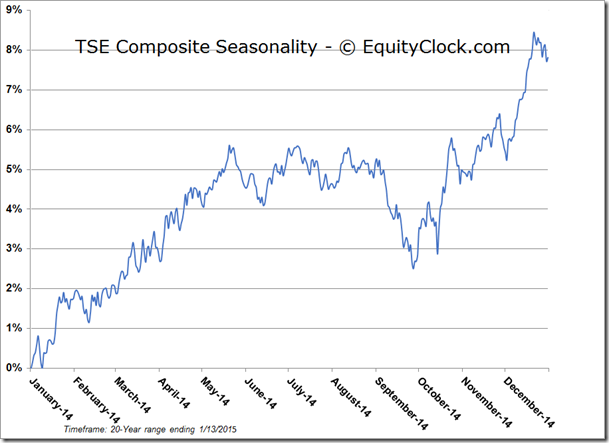
Trendline support for the homebuilding industry looks awfully similar to trendline support for the broad market, overall. On Tuesday, the S&P 500 Index tested trendline support that stretches back to the mid-October low. A break of this rising level of support would suggest a possible retest of the lows recorded three months ago. The trading activity recorded since the abrupt rebound from the September/October plunge resembles that of a consolidation pattern as investors wait for a catalyst to influence a direction, whether it be positive or negative. That catalyst could come from central bank policy, earnings, commodity market activity (oil), or something currently unforeseeable. Seasonal tendencies for the first two months of the year are neither positive nor negative, as stocks gyrate around earnings.
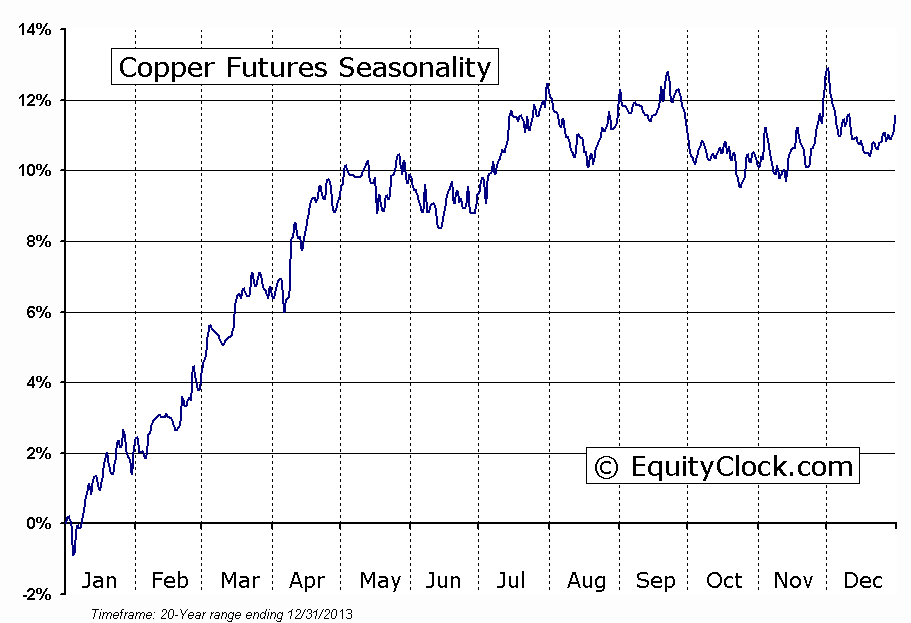
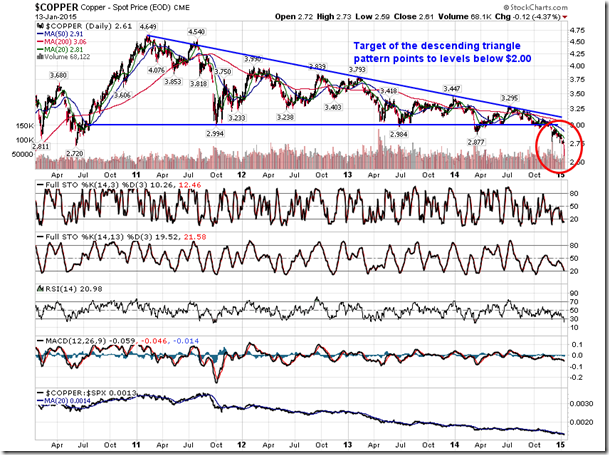
Meanwhile, looking outside of the equity market, oil isn’t the only commodity charting a parabolic move lower. Copper is down around 21% since hitting a July peak of $3.30. Back in November, the commodity traded below significant support around $3.00, breaking through the lower limit of a descending triangle pattern that dates back to the peak charted in 2011. The bearish setup targets levels below $2.00, potentially reaching towards the 2008 low of around $1.25. Seasonally, this is the time of year for copper to perform well, gaining from mid-December through to April and May, benefitting from increased manufacturing and industrial production into the spring months.
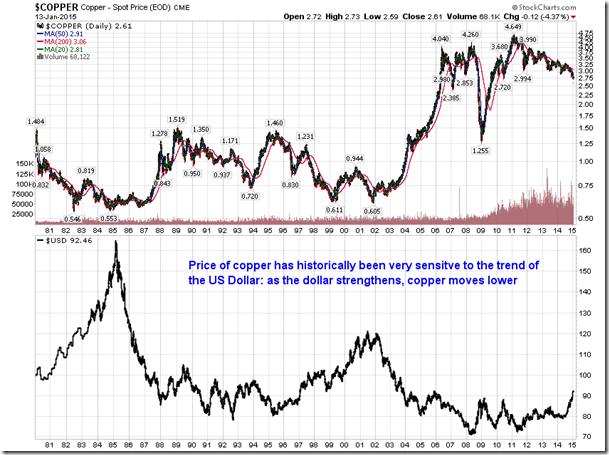
The fact that the price of copper continues to breakdown within its period of seasonal strength suggests that global economic fundamentals remain weak as demand struggles to support the price; the stronger US dollar is also a significant factor. Copper is the most sensitive commodity to the movement of the US dollar. Copper has historically shown an inverse correlation to the direction of the US dollar Index; as the US dollar has strengthened, the price of copper has traded lower, and vice versa. With a long-term basing pattern in the currency index just becoming apparent, a continued long-term decline in the price of copper has a high probability of being realized. The US dollar is expected to have a negative influence on the commodity market and the stocks of commodity producers for some time.
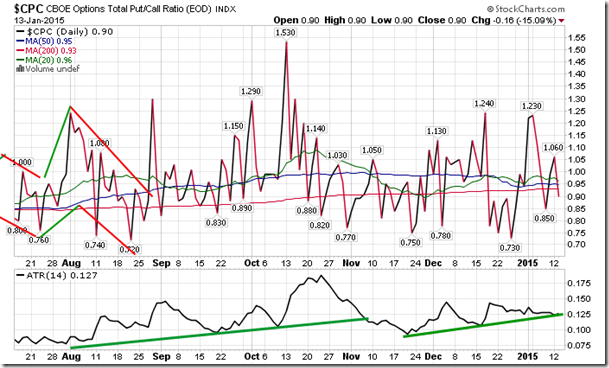
Sentiment on Tuesday, as gauged by the put-call ratio, ended bullish at 0.90.
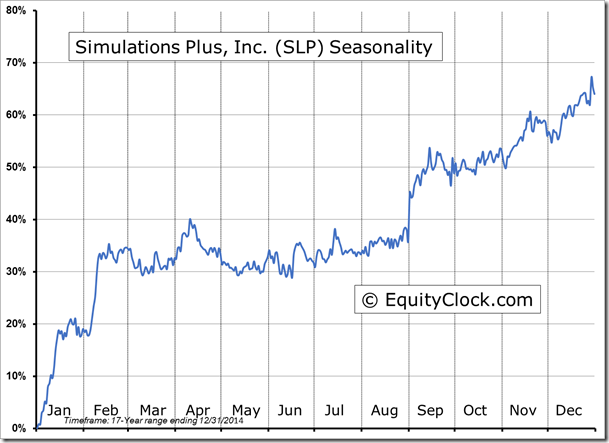
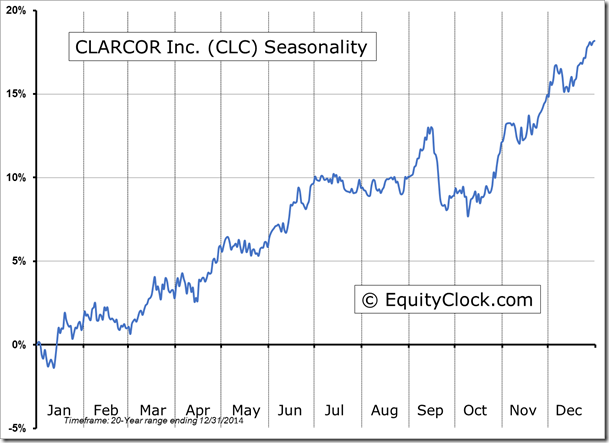
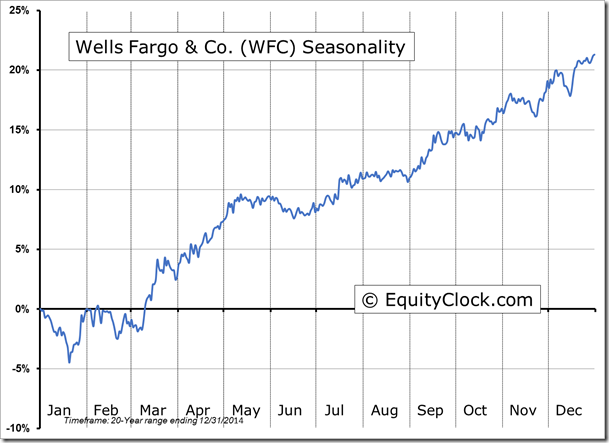
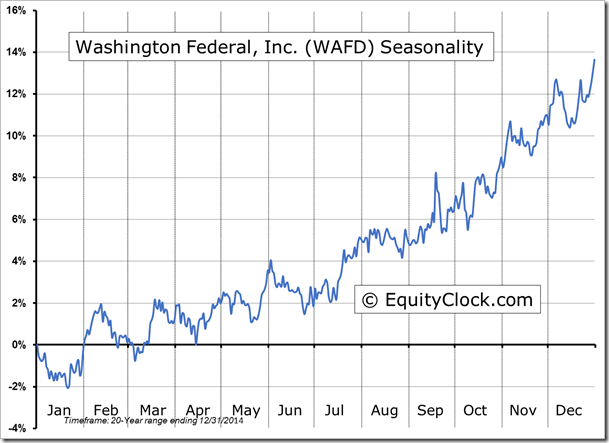
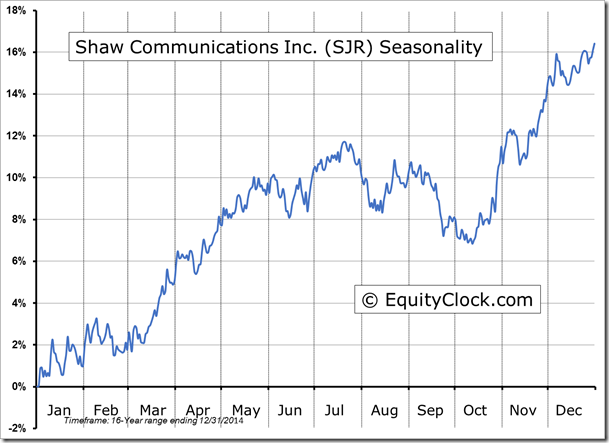
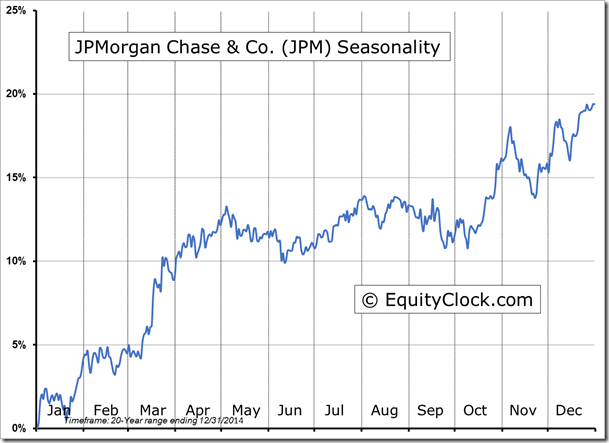
Seasonal charts of companies reporting earnings today:
S&P 500 Index
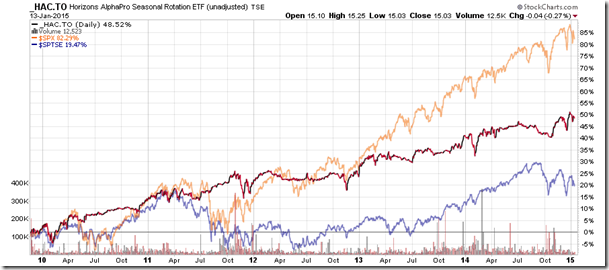
Horizons Seasonal Rotation ETF (TO:HAC)
- Closing Market Value: $15.03 (down 0.27%)
- Closing NAV/Unit: $15.07 (up 0.07%)
Performance*
| 2015 Year-to-Date | Since Inception (Nov 19, 2009) | |
| HAC.TO | -0.40% | 50.7% |
* performance calculated on Closing NAV/Unit as provided by custodian
As part of the ongoing process to offer new and up-to-date information regarding seasonal and technical investing, we are adding a section to the daily reports that details the stocks that are entering their period of seasonal strength, based on average historical start dates. Stocks highlighted are for information purposes only and should not be considered as advice to purchase or to sell mentioned securities. As always, the use of technical and fundamental analysis is encouraged in order to fine tune entry and exit points to average seasonal trends.

