Get 40% Off
👀 👁 🧿 All eyes on Biogen, up +4,56% after posting earnings. Our AI picked it in March 2024.
Which stocks will surge next?
Unlock AI-picked Stocks

Stock Market On Verge Of Major Breakdown

Published 06/30/2015, 01:24 AM
Updated 07/09/2023, 06:31 AM

In early June, we noted that the historic stock market bubble had begun to exhibit early signs of weakness, suggesting that the bull market from 2009 was becoming susceptible to a long-term reversal. Two days later, the short-term uptrend experienced a meaningful breakdown when the S&P 500 index closed well below support at the lower boundary of a rising wedge formation on the daily chart. The rising wedge breakdown signaled the likely start of a meaningful correction and today, the index declined more than 2% as it approached critical long-term support at the 200-day moving average.
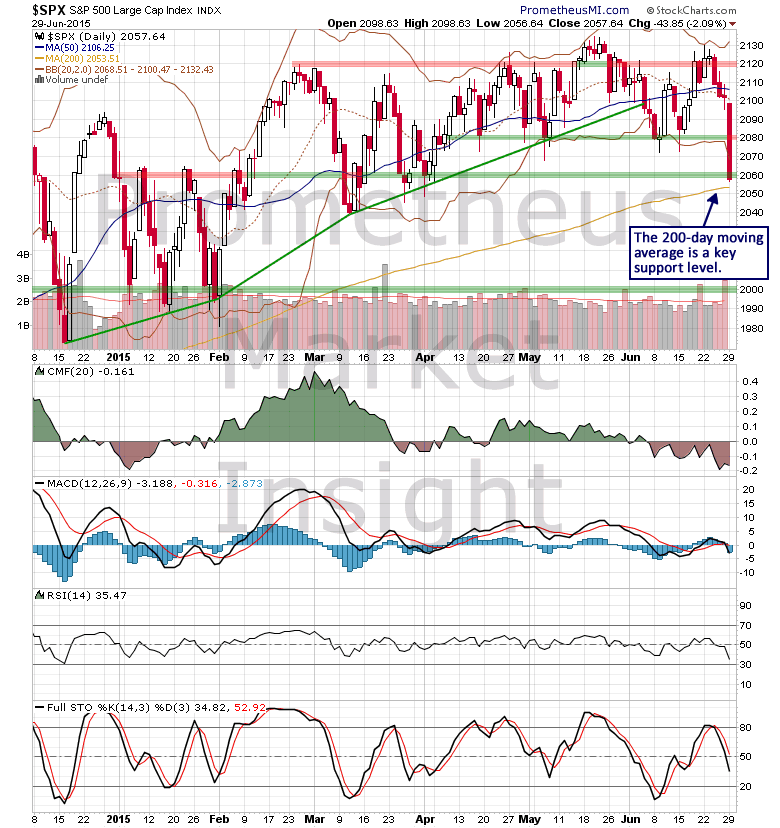
S&P 500 Daily Chart

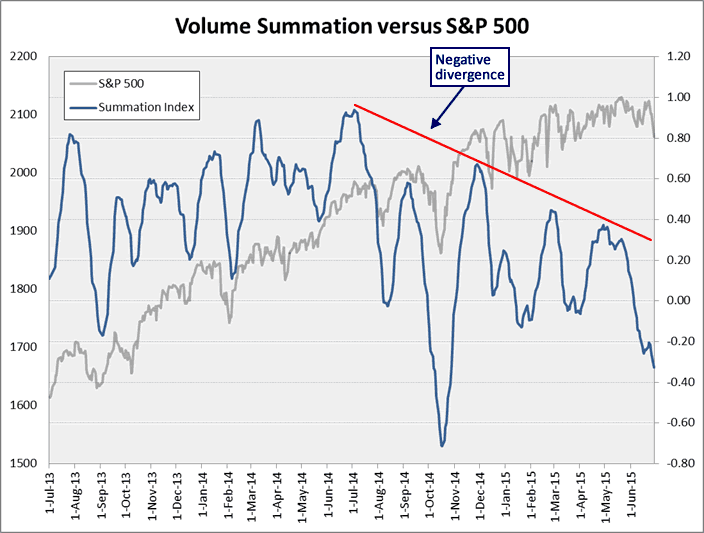
Given the continuing deterioration in market internals such as breadth and volume, a daily close well below the 200-day moving average at 2,054 would be a significant breakdown and increase the likelihood of a long-term reversal.
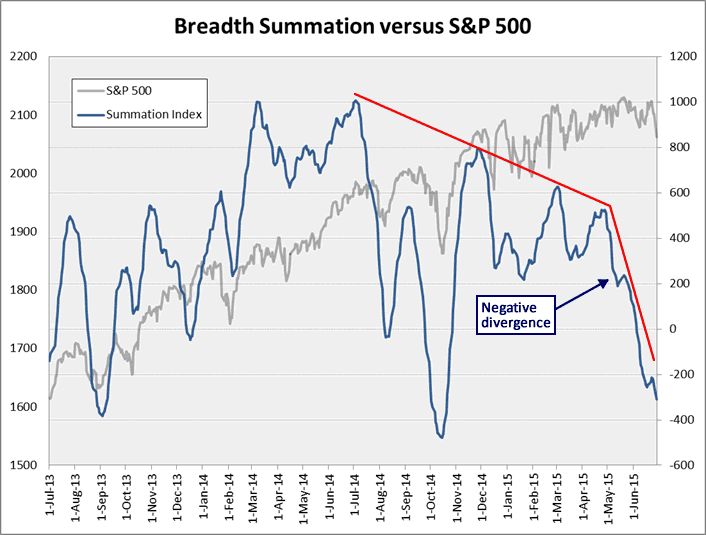
Breadth Summation Versus S&P 500

Volume Summation Versus S&P 500

With respect to cycle analysis, the sharp decline today moved well below the last short-term cycle low (STCL) in early June, signaling the likely transition to a bearish translation and favoring additional short-term weakness heading into the next low in late July or early August.
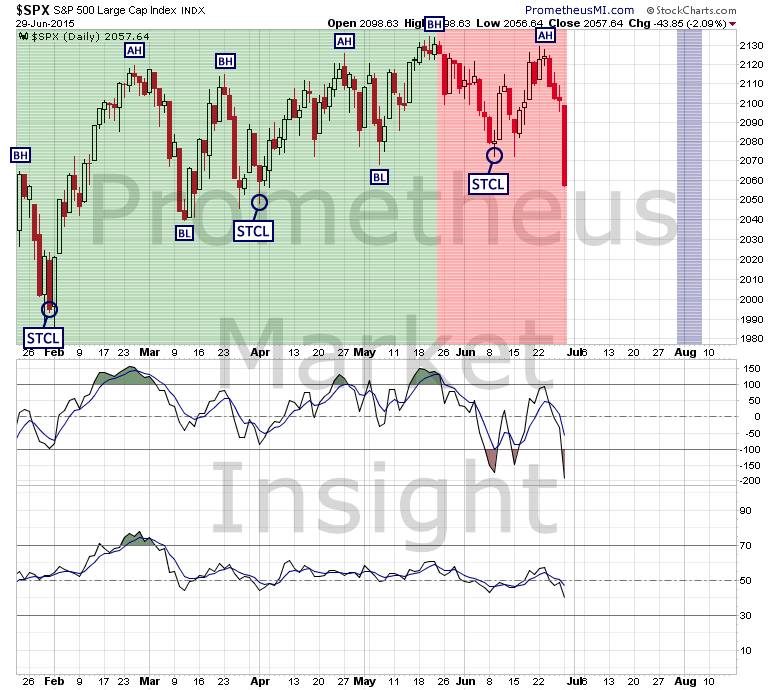
S&P Daily Chart

Moving out to the intermediate-term perspective, the sharp decline during the last four sessions is tracking the bearish scenario that we outlined last week. A weekly close on Friday at current levels or lower would signal the likely transition to a bearish intermediate-term translation and favor four to five months of additional weakness heading into the next intermediate-term cycle low (ITCL) in October or November.
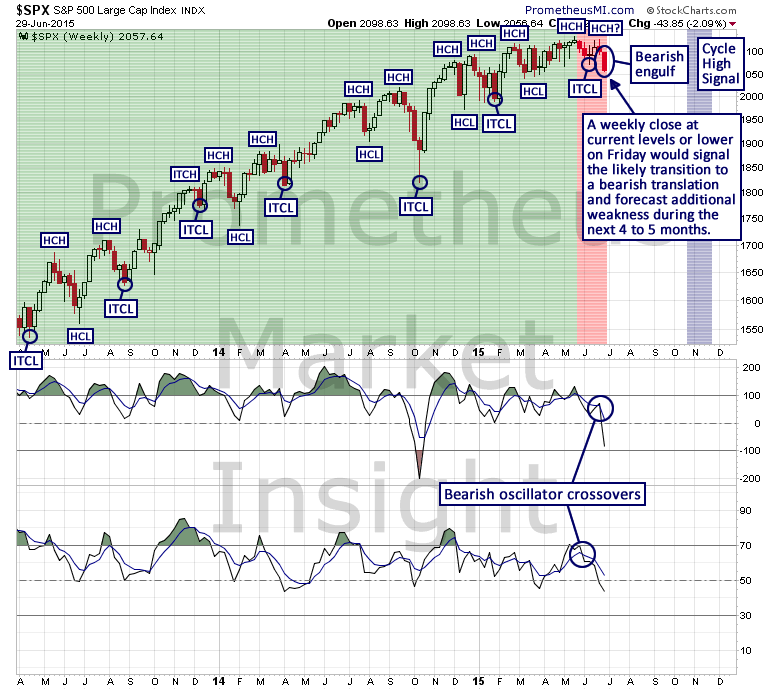
S&P 500 Weekly Chart

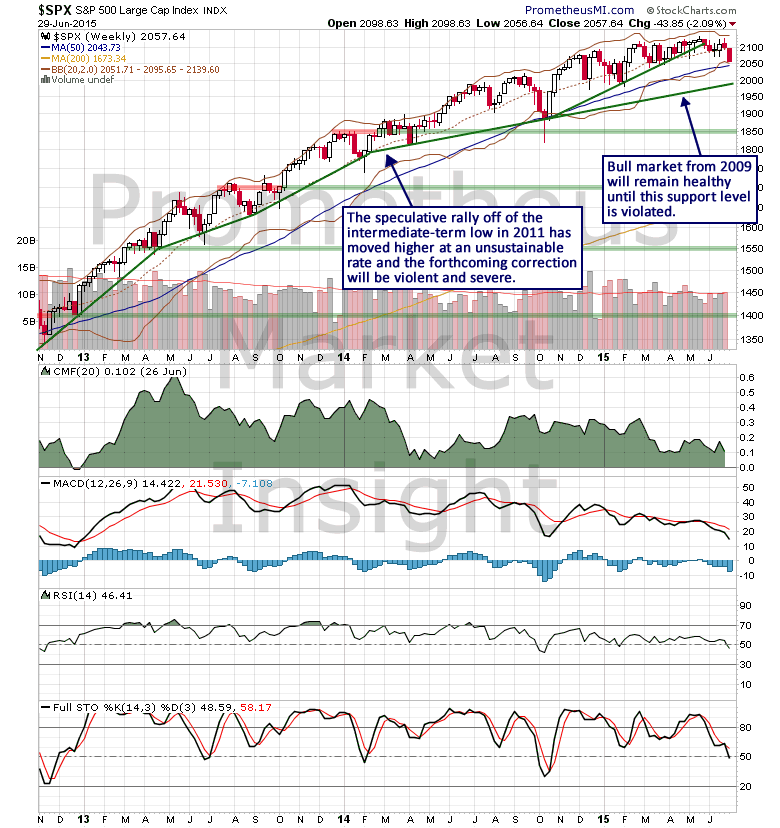
Additionally, a weekly close well below the middle of the Bollinger bands® on the weekly chart at 2,096 would predict a relatively quick return to cyclical bull market support near 1,990.S&P Weekly Chart
3rd party Ad. Not an offer or recommendation by Investing.com. See disclosure here or remove ads .

As always, it is important to remember that a long-term top is a process, not an event. The bull market from 2009 will remain healthy from a technical perspective as long as it remains above long-term uptrend support. However, the developing short-term and intermediate-term breakdowns are significant, especially when coupled with the deterioration in market internal data such as breadth and volume. The next test of bull market health will occur at the 200-day moving average, so it will be important to monitor market behavior carefully during the next several sessions.

Latest comments

Risk Disclosure: Trading in financial instruments and/or cryptocurrencies involves high risks including the risk of losing some, or all, of your investment amount, and may not be suitable for all investors. Prices of cryptocurrencies are extremely volatile and may be affected by external factors such as financial, regulatory or political events. Trading on margin increases the financial risks.
Before deciding to trade in financial instrument or cryptocurrencies you should be fully informed of the risks and costs associated with trading the financial markets, carefully consider your investment objectives, level of experience, and risk appetite, and seek professional advice where needed.
Fusion Media would like to remind you that the data contained in this website is not necessarily real-time nor accurate. The data and prices on the website are not necessarily provided by any market or exchange, but may be provided by market makers, and so prices may not be accurate and may differ from the actual price at any given market, meaning prices are indicative and not appropriate for trading purposes. Fusion Media and any provider of the data contained in this website will not accept liability for any loss or damage as a result of your trading, or your reliance on the information contained within this website.
It is prohibited to use, store, reproduce, display, modify, transmit or distribute the data contained in this website without the explicit prior written permission of Fusion Media and/or the data provider. All intellectual property rights are reserved by the providers and/or the exchange providing the data contained in this website.
Fusion Media may be compensated by the advertisers that appear on the website, based on your interaction with the advertisements or advertisers.
© 2007-2024 - Fusion Media Limited. All Rights Reserved.