The Stock Exchange is all about trading. Each week we do the following:
- Discuss an important issue for traders;
- highlight several technical trading methods, including current ideas;
- feature advice from top traders and writers; and,
- provide a few (minority) reactions from fundamental analysts.
We also have some fun. We welcome comments, links, and ideas to help us improve this resource for traders. If you have some ideas, please join in!
Review:
Our previous Stock Exchange suggested readers go beyond only fundamentals because it can be beneficial to their results. If you missed it, a glance at your news feed will show that the key points remain relevant.
This Week: How to Trade with More Perspective:
There are a variety of different valuable perspectives from which you can view your trading opportunities. For example, identifying trend reversals, understanding seasonality impacts, and using a blended approach (between “dip buying” and “trend following,” for example) are all different yet valuable perspectives, and we’ll cover each of them in more detail later is this report.
Model Performance and Announcement:
Per reader feedback, we’ve been including a table summarizing the performance results for our trading models. The following table shows actual client results after commissions and fees.
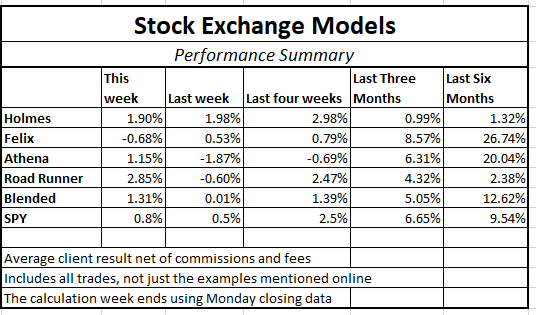
Importantly, we now have some useful, real-time trading for all of the models. This supplements the extensive development and out-of-sample periods. As I have been reporting, blending a trend-following model with a dip-buying model provides two strategies, effective in their own right, that are not correlated with each other or with the overall market. By combining the two, we can get more diversity, lower risk, and a smoother string of returns.
For these reasons I am changing the “Trade with Jeff” offer at Seeking Alpha to include a 50-50 split between Holmes and Athena. Current participants have already agreed to this. Since our costs on Athena are lower, we have also lowered the fees for the combination.
If you have been thinking about giving it a try, click through at the bottom of this post for more information.
Trading with More Perspective:
Aside from our “blended approach” (whereby we combine multiple models) there are plenty of other sources for gaining perspective as well. For example, according to Charles Kirk, spotting “trend reversals” can be an important skill for traders. He explains a useful trick in this recent Q&A excerpt:
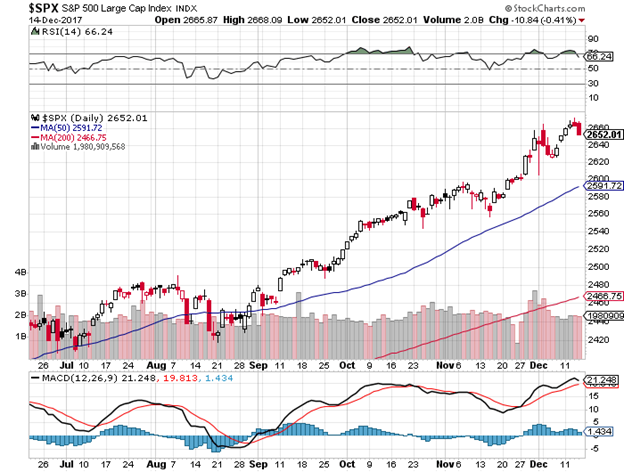
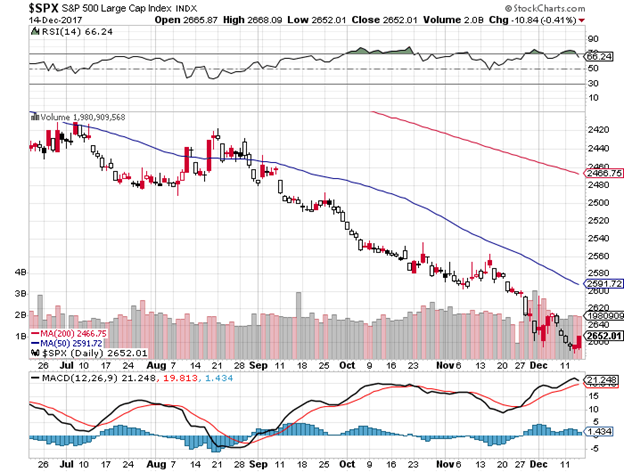
Q: When trying to spot trend reversals, I like to flip the chart upside down as it helps me identify the reversal better. Is there a way to do this without manually printing the chart out and flipping it?
A: Yes, you can flip any chart upside down at Stockcharts.com by adding a hyphen before the ticker symbol. For example, if you use the ticker symbol -$SPX this is the chart flipped upside down. It is a nifty trick that sometimes can be useful to see if you’re looking at things the correct way especially when evaluating the potential for any counter-trend reversals.
Another, perhaps more esoteric, approach for adding perspective can simply be considering your trades under a different light. For example, the following series of graphics shows which indexes, sectors, industries and commodities tend to perform best during which calendar months (each bar indicates a buy and sell date based on the optimal holding period).
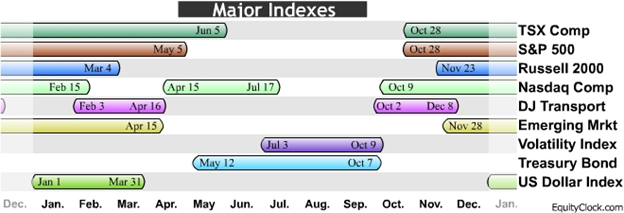
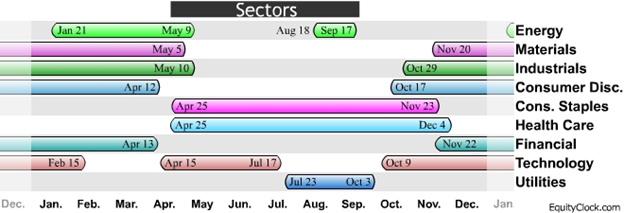
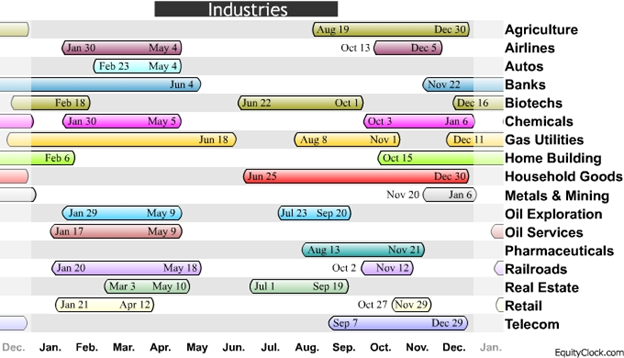
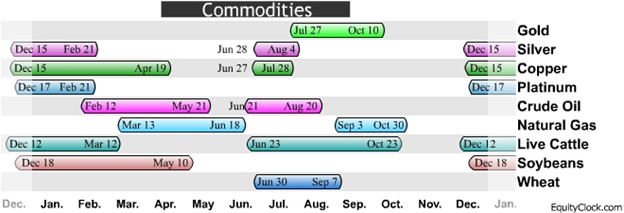
We are in the strong season for stocks, but some cross-currents from tax policies could have an impact.
We are in the strong season for stocks, but some cross-currents from tax policies could have an impact.
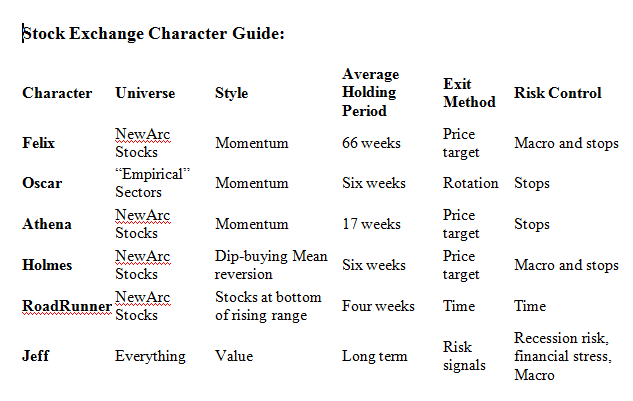
Viewing your trades from a variety of perspectives can help improve your overall results. In our case we view our aggregate trading portfolio from the perspective of both dip-buying a trend-following (as well as a variety of other risk controls, as described in the table near the end of this report).
Expert Picks From The Models:
This week’s Stock Exchange is being edited by Blue Harbinger (Blue Harbinger is a source for independent investment ideas).
Road Runner: This week I like RH (NYSE:RH). You are familiar with this company, correct?
Blue Harbinger: Yes, it’s a retailer of home furnishings, and you’ve traded this one multiple times in the past, and then bragged about it when the trade went your way.
RR: Well then, as you know, I like to buy stocks that are at the bottom of a rising channel. And based on the following chart, you can see why I like Restoration Hardware, again.
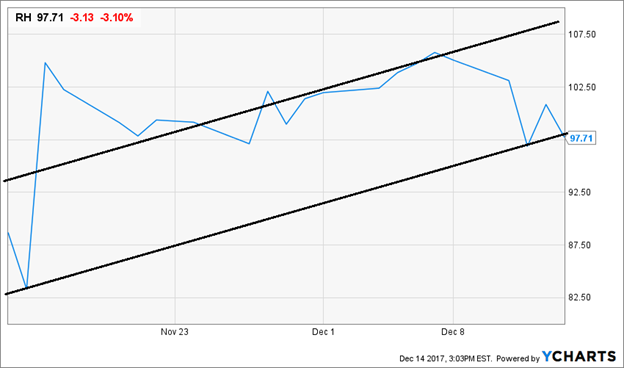
BH: Restoration Hardware has certainly been an interesting story this year, considering all the shares that have been repurchased, as well as the CEO increasing his shares significantly leading up to its most recent quarterly earnings announcement whereby the company beat expectations and raised guidance. Considering your successful track record trading this stock, I’ll be watching closely. Remind us, what is your typical holdings period?
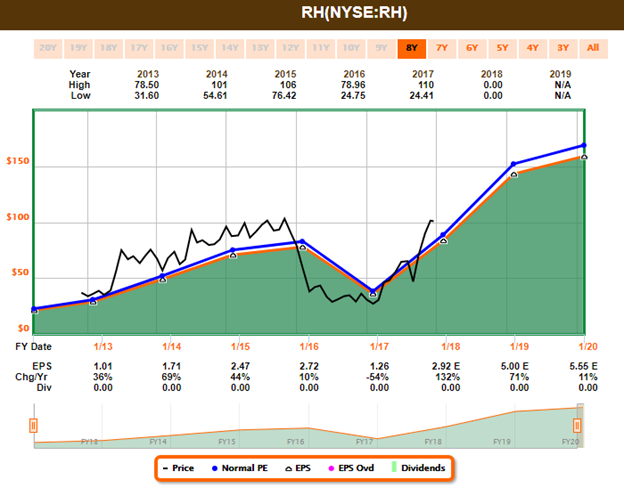
Road Runner: My typical holding period is about 4-weeks.
BH: Great, thanks. How about you, Athena—any trades for us this week?
Athena: I like First Solar (NASDAQ:FSLR).
BH: Interesting. As you know, First Solar designs, manufactures and sells photovoltaic (“PV”) solar modules with a thin-film semiconductor technology. The company operates through two segments: components and systems.
Athena: I did know that, but it’s largely irrelevant to my trade. Specifically, I am a momentum trader, and my typical holding period is only about 17-weeks. Based on the following chart, First Solar has a lot of upside price potential.
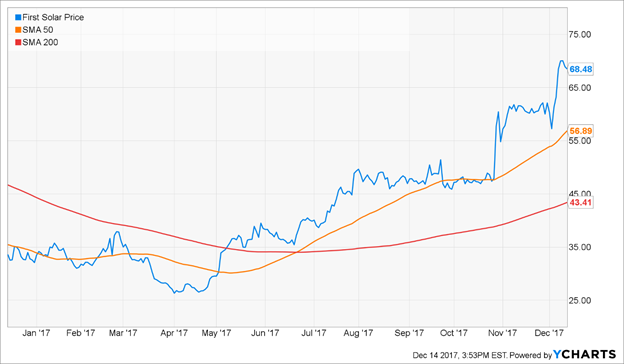
BH: Well Athena, I see the share price is up significantly this year, but for your information, First Solar had negative net income in 2016 (and margins have been thin this year). Here is a look at First Solar’s Fast Graph.
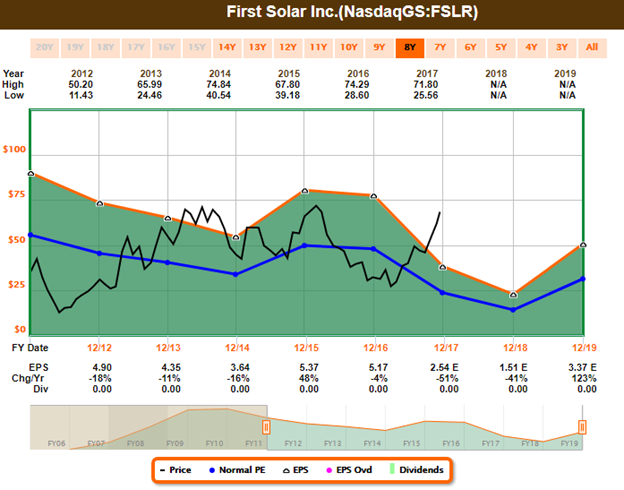
Athena: Thanks for that information, but I’m a trader, not an investor, and First Solar looks attractive right now.
BH: Well, at the very least I can say I am impressed with your performance over the last six months (as shown in the earlier performance table). How about you, Felix—what have you got this week?
Felix: This week I am sharing my ranking of the top stocks in the S&P 500. I’m showing my top 20 in the following list. Also, as you know, I am a momentum trader, but I typically hold my positions for about 66 weeks—which is much longer than the other models. I exit when my price target is hit, and I use stops and macro considerations to control risks.

BH: Thanks for that list, Felix. I see a lot of the usual suspects (i.e. stocks that have been performing well this year) which makes sense considering you’re a momentum trader. It’s interesting that Nvidia and Micron are on your list considering semiconductors have sold off hard in the last three weeks, but year-to-date they’re still doing very well. How about you Oscar, what have you got this week?
Oscar: This week I’m sharing my top ranked ETFs from the comprehensive universe of ETFs. The following table includes my top 20.
BH: Thanks Oscar. That is a very diverse group of ETFs on your list. I recall from our previous conversations that you are a momentum trader, you hold for about 6-weeks, and you control risks with stops and by rotating into a new sector. It’s interesting to me that oil (United States Oil (NYSE:USO)) is still on your list, as well as Financial Services (NYSE:IYG). I suppose if the economy keeps going strong then those could work out well. Thank you for sharing this information, Oscar.
Conclusion:
As we often mention in this Stock Exchange series, our models have a variety of advantages, such as being unemotional and having the ability to sift through large amounts of data quickly. Further, our models allow us to view stocks from different perspectives (e.g. dip-buying versus trend-following). It’s important for traders to view opportunities from multiple perspectives so they don’t miss anything, but also because different perspectives can often be combined in ways to improve the risk versus reward profile, such as our blended approach.
Background On The Stock Exchange:
Each week, Felix and Oscar host a poker game for some of their friends. Since they are all traders, they love to discuss their best current ideas before the game starts. They like to call this their “Stock Exchange.” (Check out Background on the Stock Exchange for more background). Their methods are excellent, as you know if you have been following the series. Since the time frames and risk profiles differ, so do the stock ideas. You get to be a fly on the wall from my report. I am usually the only human present and the only one using any fundamental analysis.
The result? Several expert ideas each week from traders, and a brief comment on the fundamentals from the human investor. The models are named to make it easy to remember their trading personalities.
Getting Updates:
Readers are welcome to suggest individual stocks and/or ETFs to be added to our model lists. We keep a running list of all securities our readers recommend, and we share the results within this weekly “Stock Exchange” series when feasible. Send your ideas to “etf at newarc dot com.” Also, we will share additional information about the models, including test data, with those interested in investing. Suggestions and comments about this weekly “Stock Exchange” report are welcome.
