Sterling (GBP/USD)

GBP/USD H4 – Trend and VSA
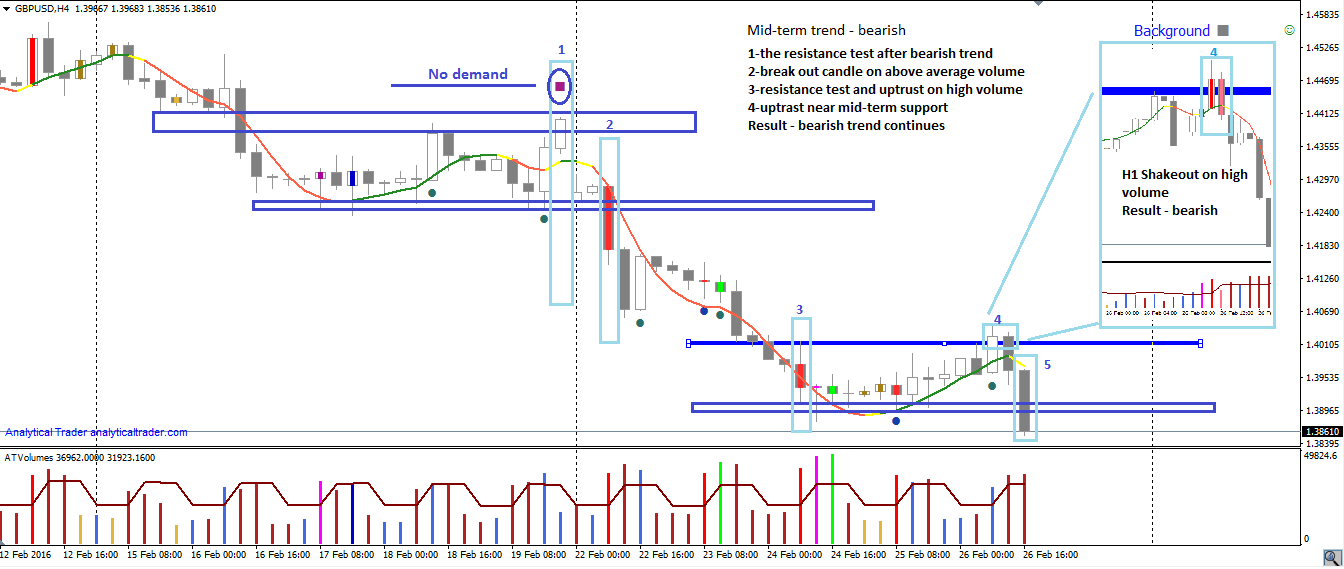
From the beginning of February we saw a downtrend on GBP/USD. After 16th February’s support break out on level 1.44000, there was a bear sign on the point 1 and 2. In the point 1, there was a supply candle near mid-term resistance level, which was detected by VSA indicator. Next, a high volume down candle appeared 22 February on the support breakout which approved the bearish sentiment. Then the signs of bearish work were evident in the point 3 and 4.
Point 3 was the first 1.41000 resistance test on high volume, and in the point 4 market showed that there was no demand above the resistance level, but the price is attractive to add to current sell positions or to open new ones, and prices fell sharply breaking out 1.39000 resistance with the support of opening sell positions of institutional investors and other big players.
The situation near the 1.41000 level is represented in top right corner of the screen, where new opening sell positions of big players caused upthrust – breaking the resistance up and then coming back down. After this dynamic trend turned down and it was the best opportunity to open short positions.
There are no bullish signals in the market, so trend tends to continue its step down motion. The possible position opening point will be the area near 1.39000 resistance, so in case of bullish intention absence at the bottom and supply power / no demand signals near 1.39000 level, sell positions are likely to benefit. Resistance tests and upthrusts will be good signals in this case.

EUR/USD – Trading Range and Breakout
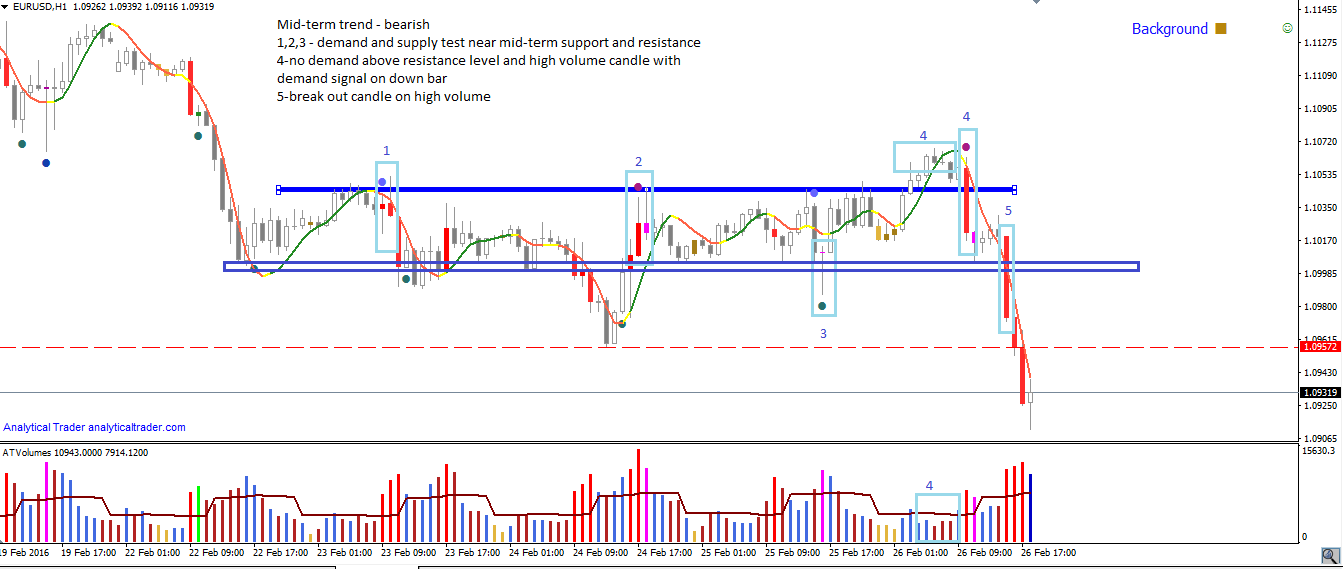
During the last 3 days, from 23th February, prices were trapped between 1.10450 resistance and 1.10000 support. Flatting within these levels, big players tested the market for the opportunity to continue the descending motion. 1 and 2 points were the resistance test places, which was shown by the indicator with supply dots. Point 3 was the place where institutional players saw that the market was ready for a small up walk, which showed on the chart as spring in point 4( peak near the bottom edge of the flat range, with prices dipping above the resistance and then coming back down again to below the resistance). After the low volumes showed that there was no demand above 1.10450 resistance level, and prices streamed down signed as low supply by the indicator purple dot, and break out the support on high volume (point 5) which confirmed bearish sentiment of big players.
The high volume down candle after the no demand above mid-term resistance level was a good sign to open sell positions with the stop loss above point 4 candle top. If there are no bullish signals such as the culmination of purchases (prices going down and up on huge, extreme volume), it’s possible to search for signs of supply 1.10000 resistance level for a short entry.
