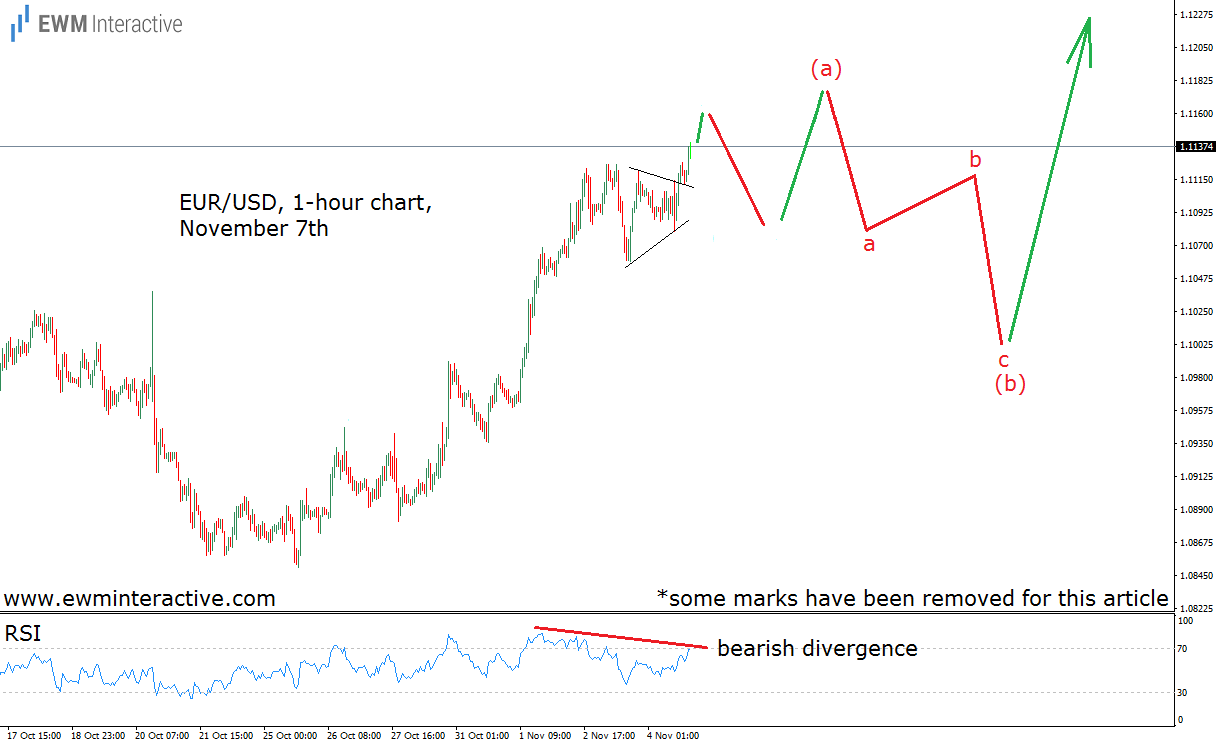
Donald Trump is going to be the 45th president of the United States. Most people outside of the U.S, including us at EWM Interactive, did not expect him to win. The preliminary polls suggested Clinton was going to get the most votes and take over the White House. So when it became clear that Trump is winning, a lot of people fell into a psychological condition similar to pure panic. Just take a look at what the financial markets did on November 9th. The prices of financial instruments from currencies through indices to commodities and stocks were bouncing up and down like a yo-yo. For instance, EUR/USD went sharply up from 1.0989 to 1.1299 and then crashed back down to 1.0830 by Friday, November 11th. However, it seems that even in the panics, the markets are still not entirely random or chaotic. Even though we were extremely surprised by Donald J. Trump’s presidential win, our EUR/USD premium clients were not that surprised by the pair’s behavior, because we sent them the following chart two days before the elections, on November 7th.(some marks have been removed for this article)
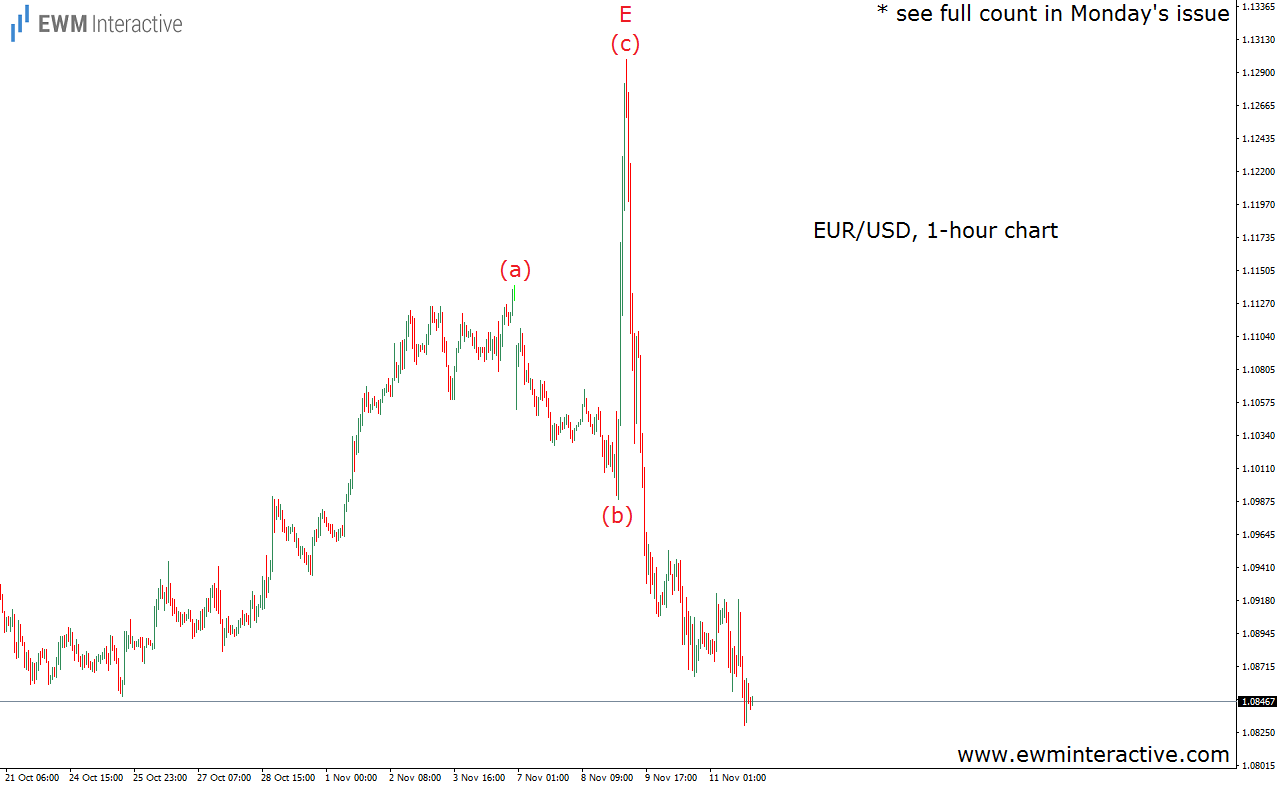
While EUR/USD was trading slightly below 1.1140, the Elliott Wave Principle and the RSI bearish divergence suggested we should expect a decline towards the 1.1000 area in wave (b), before the bulls return in wave (c) up. That is why we wrote our clients that “staying aside is preferable. Better long entries would emerge near the lows of wave (b).” The next chart shows how the situation developed.
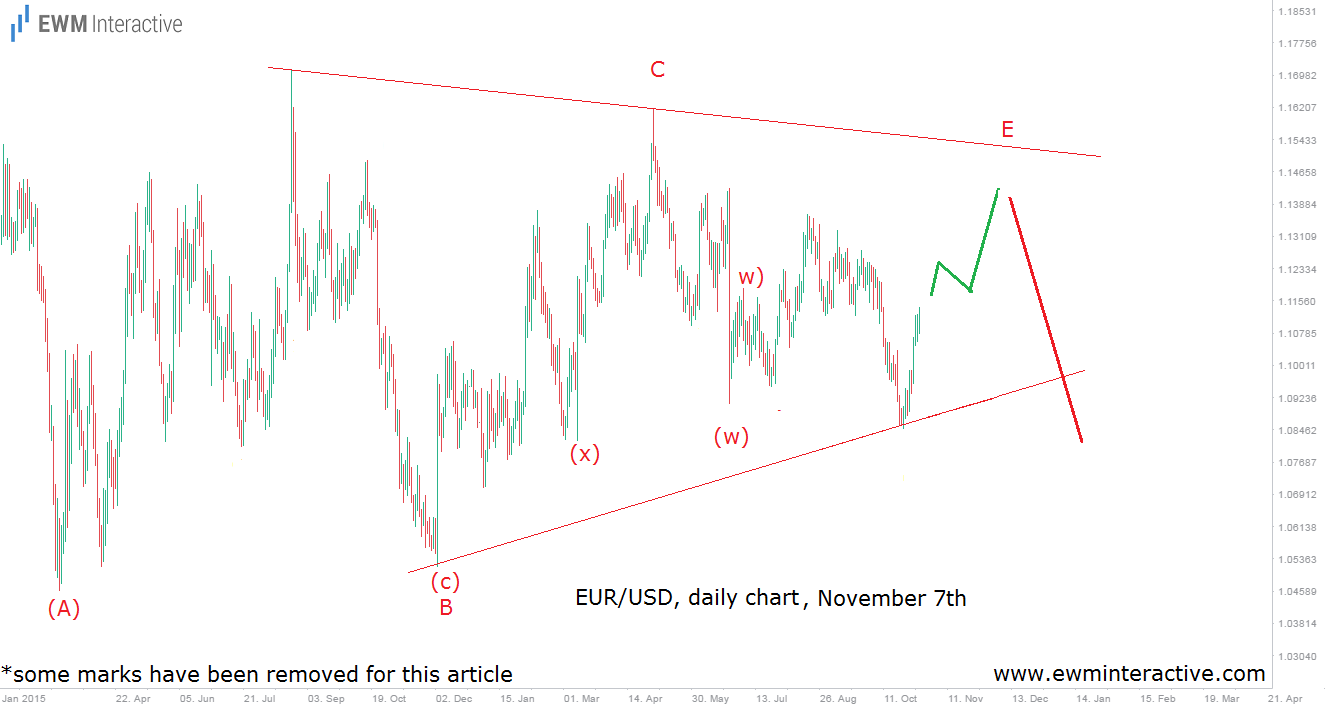
As previously mentioned, EUR/USD initially declined to 1.0989, thus providing the buying opportunity we have been waiting for, and then skyrocketed to 1.1299. So far so good, but what about the following crash? The daily chart below, also sent to clients on November 7th, shows that it did not come out of the blue, as well.
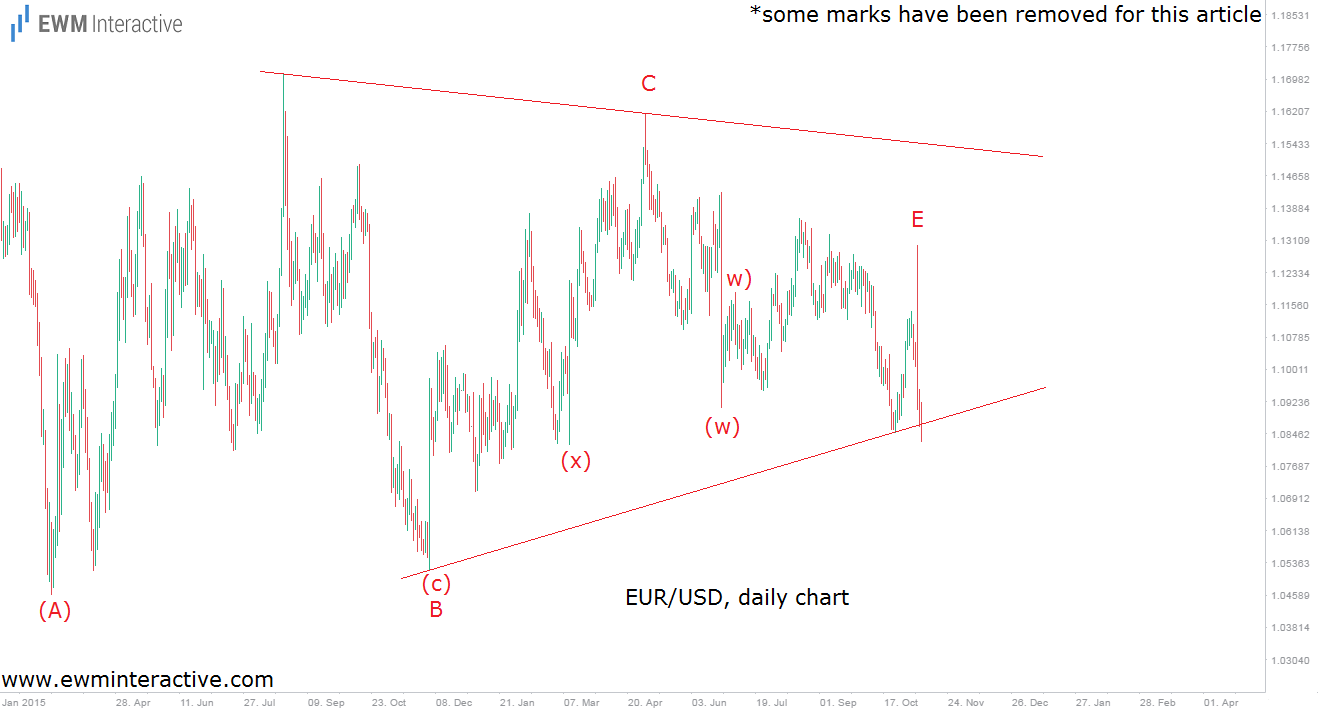
Our premium issues include multi time-frame analysis. And if the hourly chart suggested 1.1000 was the perfect level to go long on EUR/USD, the daily chart gave us a warning that we should not get too carried away with our bullishness, because once wave E of the above-shown triangle was over, the pair was supposed to reverse to the downside again. Which it did.
Even a great Elliott Wave analyst could easily fall in a trap, if analyzing just a single time-frame, because each wave has its special place in the bigger count, just like every single piece of a puzzle has its place in the big picture. As you see, if you manage to put all the pieces together correctly, you may know what to expect from the markets even when the most surprising news hits. That is the beauty of Elliott Wave analysis.
