The strengthening of the US dollar on Friday continued, which is a consequence of unchanged position for further tightening of monetary policy demonstrated by the Federal Reserve System at its last meeting. In this regard, it should be noted. that the strengthening of the US currency is observed not only in the segment of the most liquid pairs, but also in relation to a number of currencies in emerging markets. Thus, the values of the pair USD / ARS overcame the level of 41.00 and updated the maximum values for the last several decades. Mentions to the locality of such dynamics of quotations (due to the financial situation in Argentina) do not quite reflect the picture, since the same situation is observed in the pair USD/INR, where prices came close to the level of 73.00 (historical maximum). The weakening of the national currencies of a number of countries in the EM segment indicates the likelihood of players ' attacks on other currencies of emerging economies, including Russia. The strengthening the ruble with a similar background may be replaced by a new wave of weakening. The exception to the trend of strengthening of the US dollar today is the pair USD/CAD. Strengthening of the Canadian currency in this pair is a consequence of the fact that on Sunday evening the government approved an agreement with the US on NAFTA. The quotes at the opening of today's trades broke through support at 1.2900 and are at the time of writing this overview in the area of 1.2815-1.2825. In case of stabilization of quotations in the region just above 1.2800, negative dynamics has every chance of own termination. The probability of price return to the area of 1.3000 is indicated by the emerging convergence between local price minima and the corresponding values of the MACD indicator on the time frame H1.
From the economic statistics published today, it is worth paying attention to the following data:
- From 10:15 to 11:00 Moscow time, data on business activity indices in the manufacturing sector (PMI) in a number of European countries and in the Eurozone as a whole are published. The main significance for players, the actual values of these indicators, is in the answer to the question about the cessation of the negative dynamics observed during the current year, or the business activity is gradually reviving. From our point of view, the statistics in most cases will demonstrate the immutability of the situation, which indicates the lack of signals in the economy of European countries for its revival (plays on the strengthening of the US dollar).
- At 11:30 Moscow time, the data on the index of business activity in the manufacturing sector in the UK are published. The value of the indicator is predicted at 52.6 points. From my point of view, the situation here will be similar to the situation in other European countries and the statistics will be either neutral or weak.
- At 12:00 Moscow time, the unemployment rate in the Eurozone for August is published. And here everything should be good. The prediction is at around 8.1%, which should confirm the strong state of the labor market.
- at 16:45 and 17:00 Moscow time, indexes of business activity in the manufacturing sector in the US are published for September. The actual values of the indicators should give a positive impetus to the US dollar.
Today, in the markets, in general, the tendency of strengthening the US currency is predicted. At the same time, depending on the published statistics, local outbursts of quotations are possible, which, however, will not be able to reverse the general trend.
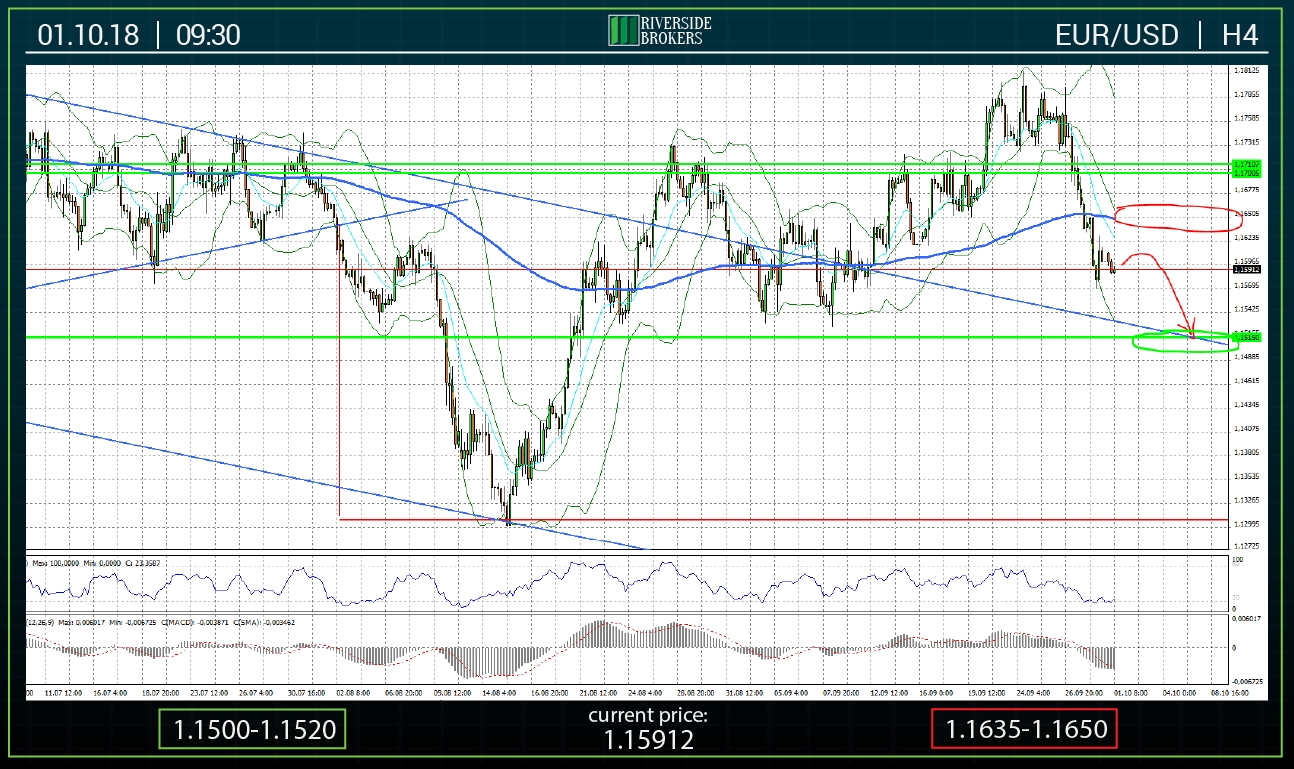
In the last hours of Friday, the EUR/USD pair broke down the support around 1.1600. On Monday morning, the quotes are around 1.1580-1.1585, trying to determine the further dynamics. Today are published the important data for the European currency on PMI in the manufacturing sector for September as well as the unemployment rate in August. These indicators will allow players to track the dynamics of the current state of the European economy, which may have a local impact on the dynamics of quotations. However, this does not cancel the general trend of strengthening the US dollar observed in recent trading sessions. Today, a short-term return of quotations to the area above the level of 1.1600 is predicted, after which the negative dynamics will be further developed.
The area of support is 1.1500-1.1520.
Resistance is present in the range of 1.1635-1.1650.
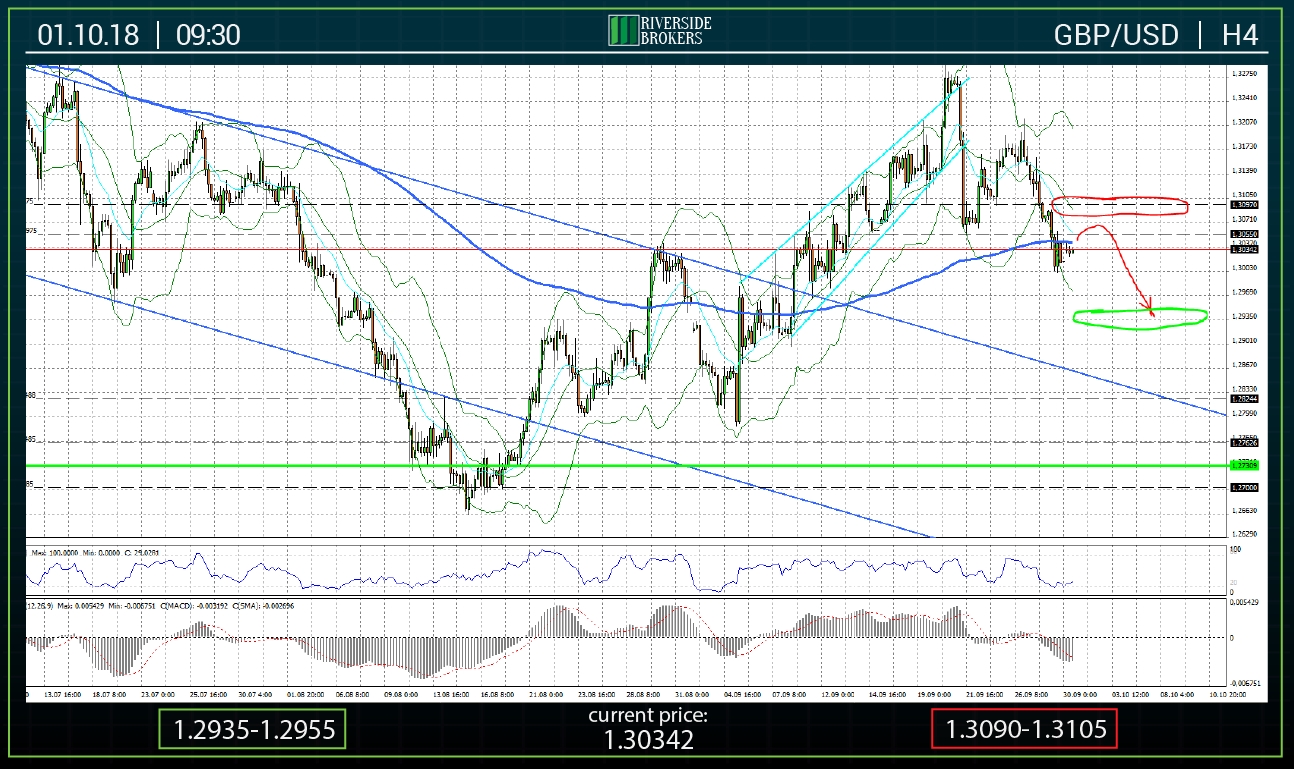
Today, a short-term correction of quotations to the level of 1.3100 is predicted, after which prices will show a downward trend in order to reduce to the area of 1.2950-1.2960. The probability of local growth is indicated by the convergence between the local lows of quotations on September 21 and 28 and the corresponding values of the MACD indicator on the H1 time frame.
The support zone is located at 1.2935-1.2955 (green oval).
The resistance zone is present in the range 1.3090-1.3105 (red oval).
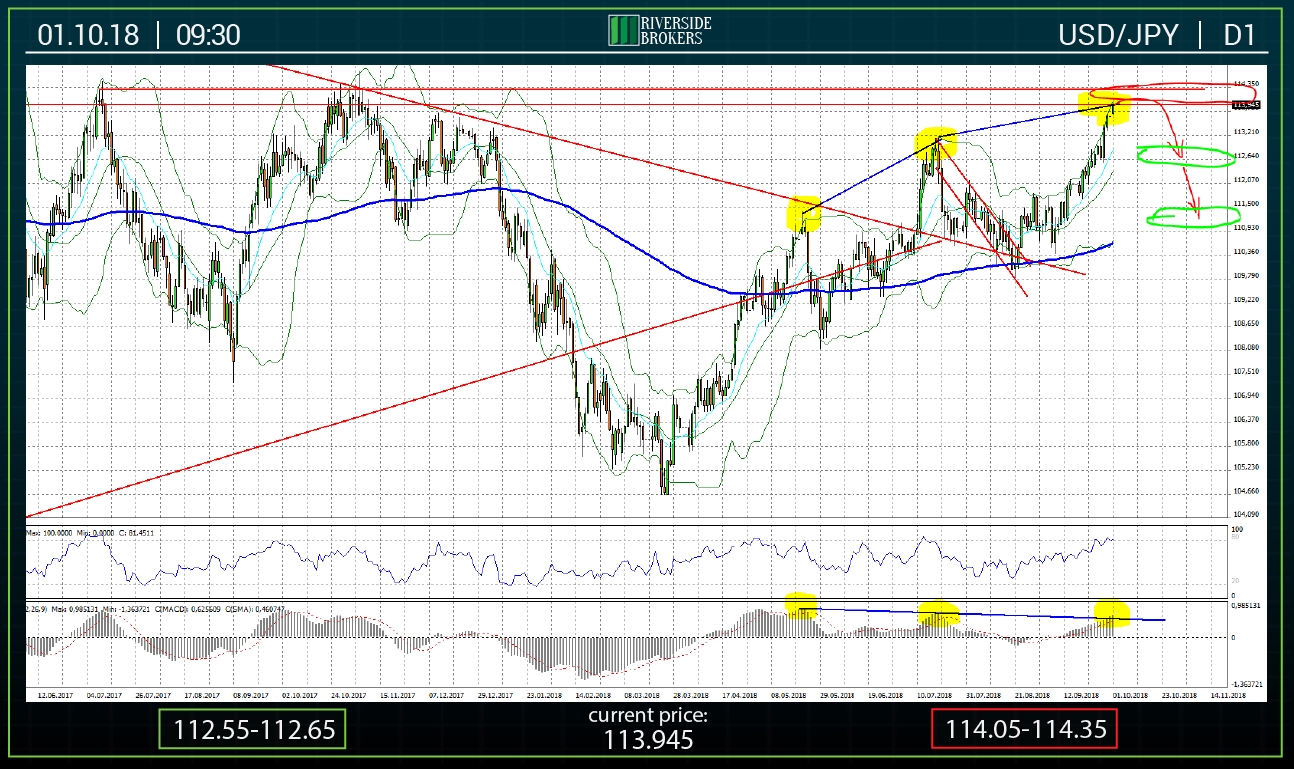
As a result of the strengthening of the US dollar against the Japanese yen, the quotes of the pair USD / JPY almost reached the level of 114.0 by today’s morning. in view of this, I want to note that in the range of 114.00-114.50 there is strong resistance. It is in this range that the maximum prices for the current year are observed in the first half of January. In addition, the technical picture of the pair indicates the formation of corrective signals. Local price highs observed on may 19, July 21, September 28 and today, each subsequent of which exceeded the value of the previous one, are not accompanied by a similar dynamics of the MACD indicator on the time frame D1, which signals the probability of the beginning of a decline in quotations. As noted in the previous overview, the growth of the pair, to a greater extent, is the emotional response of players to the trend of strengthening the US dollar in world markets.
The support zones are subsequently located in the ranges 112.55-112.65 and 111.35-111.50 (green ovals).
The resistance zone is located at 114.05-114.35 (red oval).
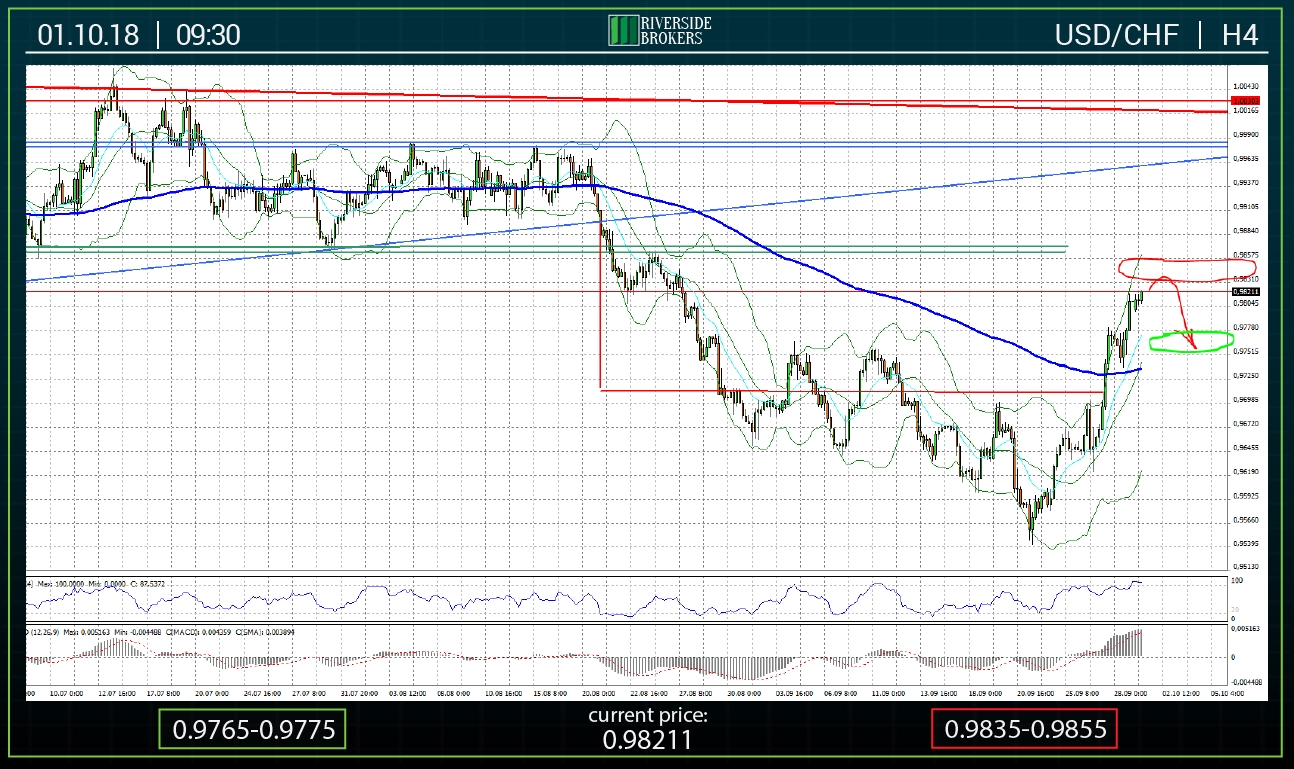
Today, it is projected the stabilization of quotations from the pair USD/CHF just below the resistance area around the level of 0.9855. Then, in the second half of the day, it is not excluded the beginning of the correction movement with the aim of reducing to the area of 0.9760-0.9780. The pair needs to take a break. One could not run ahead of the locomotive. It will catch up anyway.
The dynamics of the pair in the following trading sessions will be in line with the general sentiment in the markets. From my point of view, the strengthening of the US dollar will be further developed, which will bring the pair's quotes to the inner area of the triangle, in which the pair traded between June 14 and August 21 this year.
Today the support zone is in the area of 0.9765-0.9775 (green oval on the chart).
The resistance is located in the range of 0.9835-0.9855 (red oval).


