
Industrial tool maker Stanley Black & Decker Inc. (NYSE:SWK) kept its earnings streak alive in first-quarter 2017, with positive earnings and sales surprises of 8.4% and 2%, respectively. Earnings from continuing operations came in at $1.29 per share, surpassing the Zacks Consensus Estimate of $1.19 and marginally above the year-ago tally of $1.28.
The company’s net sales totaled $2.806 billion, above the Zacks Consensus Estimate of $2.75 billion. Also, the top line grew 5% year over year on the back of 5% and 3% positive impact of volume and acquisitions, respectively, partially offset by 1% adverse impact of unfavorable currency movements and 2% from divestitures.
Segmental Revenues
Stanley Black & Decker reports revenues under three market segments. A brief discussion on the segments’ quarterly results is provided below:
Tools & Storage generated revenues of $1,854.5 million, up 9% year over year and represented 66.1% of net revenue in the quarter. Organic revenues grew 6% while acquisitions had a positive 4% impact. These were partially offset by 1% negative forex impact.
Industrial segment’s revenues accounting for roughly 16.8% of net revenue, came in at $472.6 million, up 3% year over year. The growth was triggered by volume gains of 5%, partially offset by 1% negative price impact and adverse currency impact of 1%.
Revenues from Security, roughly 17.1% of net revenue, decreased 5% year over year to $478.5 million. Favorable price impact of 1% and acquisition gain of 1% were more than offset by 1% negative impact of forex losses and 6% negative impact of divestitures.
Margins
In the quarter, Stanley Black & Decker’s margin profile improved on the back of 2% growth in revenues, partially offset by 2.7% increase in cost of sales. Gross margin increased 160 basis points (bps) to 38.2%. Selling, general and administrative expenses grew 7.4% year over year while as a percentage of revenues, it inched up 50 bps to 24%.
Balance Sheet & Cash Flow
Exiting the first quarter, Stanley Black & Decker had cash and cash equivalents of $378 million, considerably below $1,131.8 million in the previous quarter. Long-term debt (net of current portions) was roughly flat at $3,815.6 million.
In the quarter, Stanley Black & Decker’s net cash usage on operating activities increased 56.4% to $145.6 million. Capital spending totaled $64.7 million versus $64.9 million in the year-ago quarter. Free cash outflow was $210.3 million compared with $158 million outflow recorded in the year-ago quarter.
During the quarter, the company paid cash dividends of approximately $86.7 million and repurchased shares worth $17.3 million.
Outlook
For 2017, Stanley Black & Decker increased its earnings forecast to $7.08−$7.28 per share from the previous projection of $6.98−$7.18. The revised guidance includes anticipated earnings accretion from Newell Tools and Craftsman Brand acquisitions and earnings dilution from disposition of Mechanical Security businesses as well as improved industrial businesses.
Compared with its previous guidance, incremental organic revenue growth is likely to contribute 8 cents per share to earnings while incremental cost and productivity actions will add 10 cents. Higher environmental charges will dilute earnings by 8 cents.
Free cash flow conversion is predicted to be 100%.
Stanley Black & Decker, Inc. Price and Consensus
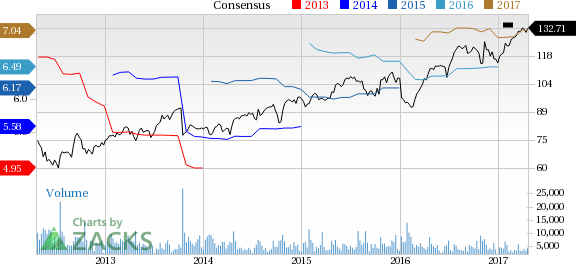
Stanley Black & Decker, Inc. Price and Consensus | Stanley Black & Decker, Inc. Quote
Zacks Rank & Stocks to Consider
With a market capitalization of $20.3 billion, Stanley Black & Decker currently carries a Zacks Rank #2 (Buy). Other stocks worth considering in the machinery industry include Lincoln Electric Holdings, Inc. (NASDAQ:LECO) , Sandvik AB (OTC:SDVKY) and Parker-Hannifin Corporation (NYSE:PH) . All these stocks sport a Zacks Rank #1 (Strong Buy). You can see the complete list of today’s Zacks #1 Rank stocks here.
Lincoln Electric Holdings’ earnings estimates for fiscal 2017 and fiscal 2018 were revised upward in the last 60 days. Also, the company posted an average positive earnings surprise of 4.66% for the last four quarters.
Sandvik AB’ earnings estimates for 2017 and 2018 were revised upward in the last 60 days.
Parker-Hannifin reported an average positive earnings surprise of 12.44% for the last four quarters. Also, earnings expectations for fiscal 2017 and fiscal 2018 improved over the past 60 days.
More Stock News: 8 Companies Verge on Apple-Like Run
Did you miss Apple (NASDAQ:AAPL)'s 9X stock explosion after they launched their iPhone in 2007? Now 2017 looks to be a pivotal year to get in on another emerging technology expected to rock the market. Demand could soar from almost nothing to $42 billion by 2025. Reports suggest it could save 10 million lives per decade which could in turn save $200 billion in U.S. healthcare costs.
A bonus Zacks Special Report names this breakthrough and the 8 best stocks to exploit it. Like Apple in 2007, these companies are already strong and coiling for potential mega-gains. Click to see them right now >>
Lincoln Electric Holdings, Inc. (LECO): Free Stock Analysis Report
Stanley Black & Decker, Inc. (SWK): Free Stock Analysis Report
Sandvik AB (SDVKY): Free Stock Analysis Report
Parker-Hannifin Corporation (PH): Free Stock Analysis Report
Original post
Zacks Investment Research