
RSI- presently, the RSI indicator appears to be mirroring the stock. From its peak the stock now looks like it is forming a symmetrical triangular pattern which is always signifying consolidation. The indicator is mirroring the same thing, as it peaked and presently it is erratically moving up and down right on the 50 line which separates the Bulls from the bears. So it also signifies consolidation.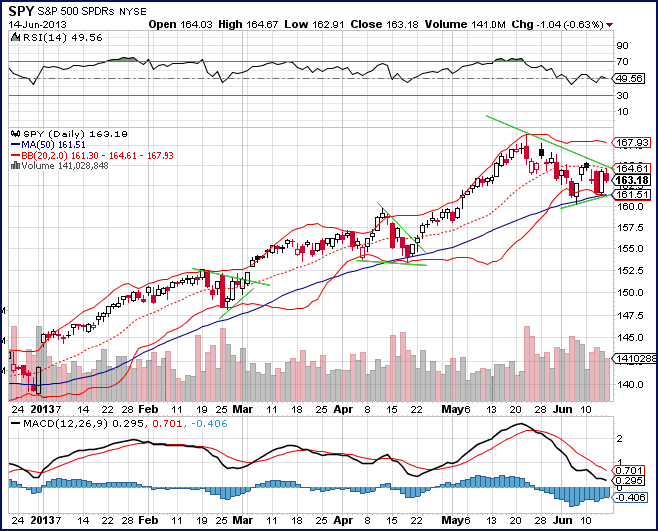
MACD- the MACD indicator on the other hand gives us a hint of a bullish tendency in this consolidation pattern because it looks like it's forming a bottom, but the bottom is above the zero line. Even though it looks like momentum here has a bullish lean, since there is no support from the RSI indicator in the stands alone we will not give it a lot of significance.
Bollinger Bands®- this particular consolidation pattern appears to be using the middle Bollinger band as resistance presently. It is also using the 50 day moving average as support. Since these two has intersect I will be interested in seeing how the stock is going to move this coming week.
Summary- the stock is definitely consolidating and this week will dictate which way the market moves. Anticipating what the Feds will say I would expect the markets to after Wednesday's meetings.
Current Events
Another volatile trading week has come to an end, with the major U.S. indices in the red overall and the Dow on Friday seeing its fourth straight day of triple-digit swings. Central bank concerns, from lack of further Bank of Japan action to continued worries over the timing of Fed tightening, led the way; Japan's Nikkei also saw some serious action, plunging to officially enter bear market territory on Thursday before recovering a bit on Friday, while the yen soared against the dollar.
The rally in stocks stumbled and Treasury bond yields rose to 14-month highs following Chairman Ben Bernanke's comments that the Fed may decide to begin scaling back its quantitative easing in the next few policy meetings if the economy improves.
As part of its quantitative easing policy, adopted more than four years ago, the Fed has been buying Treasury and other bonds each month to keep interest rates low and promote growth.
Although earnings have taken a back seat to Fed talk, forecasts for second-quarter profits have come down in recent weeks. Growth is forecast at 3.2 percent, down from an April 1 forecast of 6.1 percent, and negative pre-announcements have outnumbered positive ones by a ratio of 6.9 to 1, according to Thomson Reuters data. That would be the most negative ratio since at least 1996.
While many investors are sharply focused and anxious about what the Fed might reveal about future tapering plans next week, Ethan Harris, co-head of global economics research at Bank of America, said earlier this week that the U.S. central bank would really only begin to taper after strong, sustained evidence that the economy is on solid ground. But even then, the Fed wouldn't suddenly go from $85 billion of monthly bond purchases to zero.
Disclosure: I have no positions in any stocks mentioned, and no plans to initiate any positions within the next 72 hours.
- English (UK)
- English (India)
- English (Canada)
- English (Australia)
- English (South Africa)
- English (Philippines)
- English (Nigeria)
- Deutsch
- Español (España)
- Español (México)
- Français
- Italiano
- Nederlands
- Português (Portugal)
- Polski
- Português (Brasil)
- Русский
- Türkçe
- العربية
- Ελληνικά
- Svenska
- Suomi
- עברית
- 日本語
- 한국어
- 简体中文
- 繁體中文
- Bahasa Indonesia
- Bahasa Melayu
- ไทย
- Tiếng Việt
- हिंदी
SPY: Its All About Bernanke This Week
Published 06/16/2013, 03:17 AM
Updated 07/09/2023, 06:31 AM
SPY: Its All About Bernanke This Week
Technically Speaking
Latest comments
Loading next article…
Install Our App
Risk Disclosure: Trading in financial instruments and/or cryptocurrencies involves high risks including the risk of losing some, or all, of your investment amount, and may not be suitable for all investors. Prices of cryptocurrencies are extremely volatile and may be affected by external factors such as financial, regulatory or political events. Trading on margin increases the financial risks.
Before deciding to trade in financial instrument or cryptocurrencies you should be fully informed of the risks and costs associated with trading the financial markets, carefully consider your investment objectives, level of experience, and risk appetite, and seek professional advice where needed.
Fusion Media would like to remind you that the data contained in this website is not necessarily real-time nor accurate. The data and prices on the website are not necessarily provided by any market or exchange, but may be provided by market makers, and so prices may not be accurate and may differ from the actual price at any given market, meaning prices are indicative and not appropriate for trading purposes. Fusion Media and any provider of the data contained in this website will not accept liability for any loss or damage as a result of your trading, or your reliance on the information contained within this website.
It is prohibited to use, store, reproduce, display, modify, transmit or distribute the data contained in this website without the explicit prior written permission of Fusion Media and/or the data provider. All intellectual property rights are reserved by the providers and/or the exchange providing the data contained in this website.
Fusion Media may be compensated by the advertisers that appear on the website, based on your interaction with the advertisements or advertisers.
© 2007-2024 - Fusion Media Limited. All Rights Reserved.