- SPX Monitoring purposes; Long SPX on 11/30/16 at 2198.81.
- Monitoring purposes Gold: Covered on 11/9/19 at 24.59 = gain .07%: Short GDX 11/2/16 at 24.78.
- Long-term trend monitor purposes: Short SPX on 1/13/16 at 1890.28

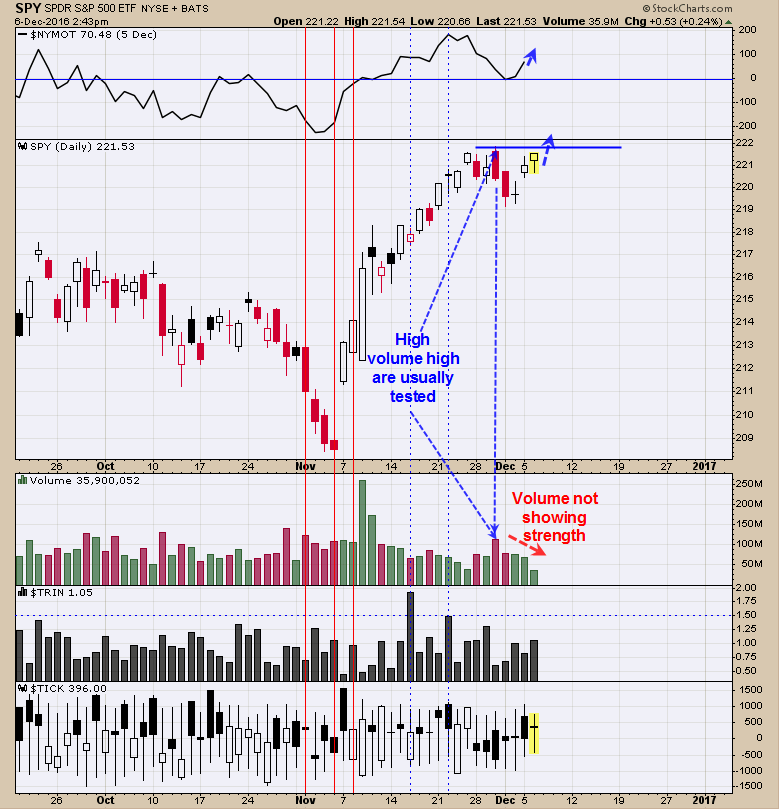
Above is what may materialize short term. On November 30 the SPY touched a new high on higher volume and most high volume highs are tested and therefore the November 30 high of 221.82 should be touched at a minimum. If the current rally tests the November 30 high on lighter volume it would be a bearish sign for short term and on higher volume would be a bullish sign. So far on this rally the volume has been lack luster and a bearish sign. Also the McClellan Oscillator will help to define the trend. If the McClellan Oscillator continues to move higher as the SPY moves higher will continue to have a bullish tone. We have had a previous target near 2220 range on the SPX and if bearish signs do develop near that range we may step out of our long SPX position.

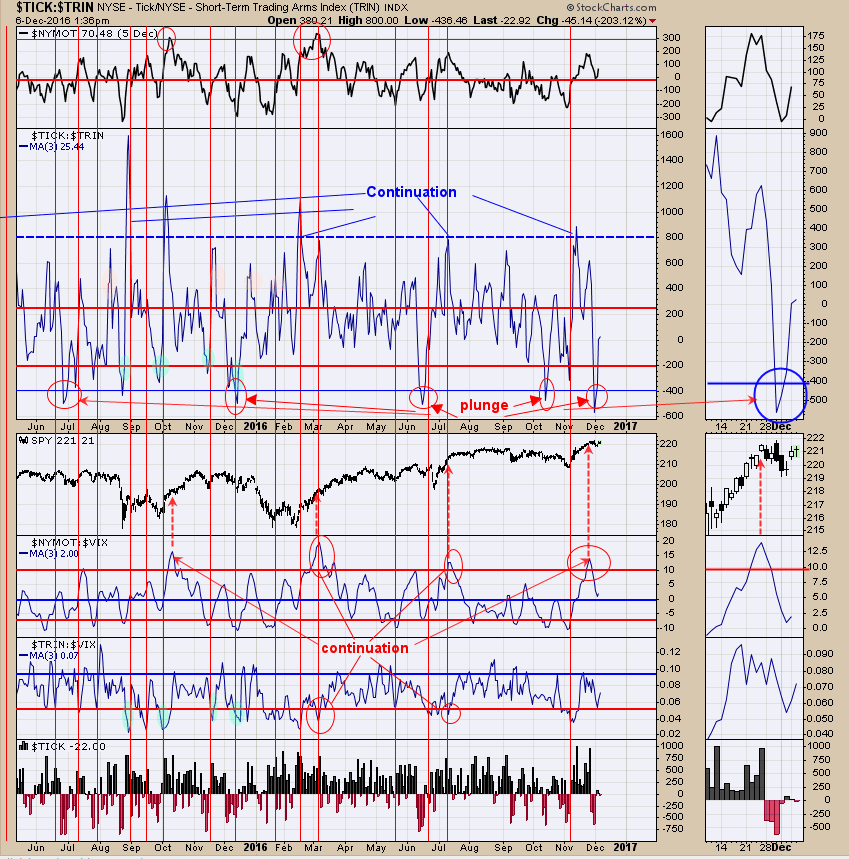
The second window down from the top is the TICK/TRIN ratio. Its rare of this ratio to fall below -400 (happen four times last 19 months) and when it has market produced a plunge in the not so distance future. Three times the plunge occurred about a month later and once it took two month for the plunge to materialize. This ratio helps to improve the odds of a steep decline in January that was discussed on yesterday’s report. The top window is the McClellan Oscillator. The rally from the November 4 low the McClellan Oscillator managed to reach a high of +181. In strong market the Oscillator will reach above +300. If the SPY does hit a new short term high (expected) and McClellan Oscillator fails to reach +181 will add to the idea that a short term high is not far off. Long SPX on 11/30/16 at 2198.81.

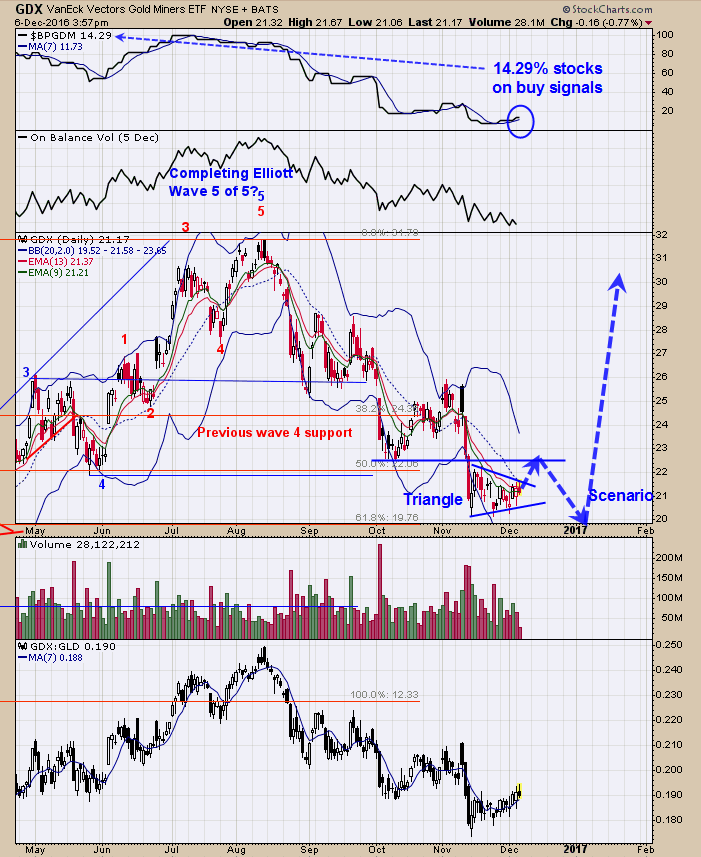
A Triangle pattern has been forming since November 14. It common for Triangle pattern on the first break to be a false breakout and it could happen here on GDX. GDX may have a minor break to the upside near 22.50 ( Resistance lies at the October lows near 22.50) before falling back down and Testing or breaking to a minor new low below the November 14 low which comes in earn 20.00 range. The up down volume % and Advance/Decline % remain in bearish territory but are showing positive divergences suggesting more time is needed to complete the bottom process. The next buy signal (probably below 20.00 on GDX) could lead to a multi month rally that we expect to at least test the previous high near 32.00 range.
