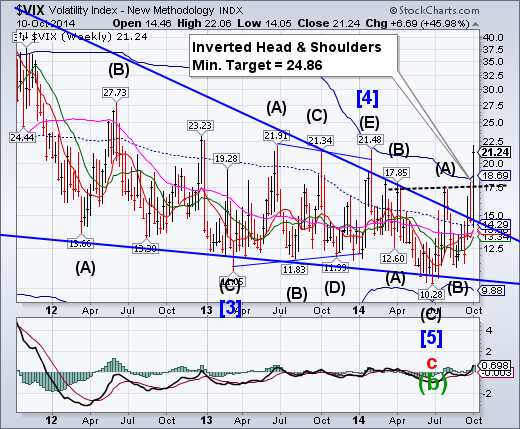
-- VIX broke above the neckline of an inverted Head & Shoulders formation that indicates a probable surprise target in the near term. VIX displays an exponential fractal pattern that, if repeated, may surprise many to the upside.
SPX is now challenging Long-term support.
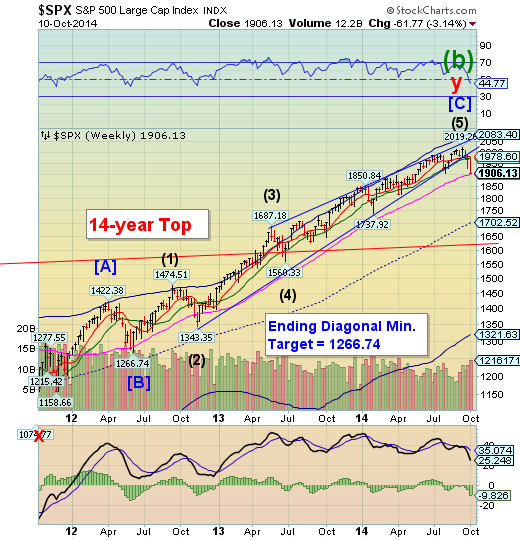
SPX is now challenging Long-term support at 1901.71.This is the first visitation of Long-term support since November, 2012, when the Ending Diagonal was just beginning.Once Long-term support is broken, it may become resistance. The next support beneath is the weekly mid-Cycle support at 1702.52, a likely near-term candidate should Long-term support fail.
Technical analysis suggests that an Ending Diagonal may be completely retraced, once broken. A Cyclical change of trend occurs once beneath mid-Cycle support/resistance.
(ZeroHedge) Just over a week ago, the Japanese stock market participants were stunned when stock orders amounting to a whopping $617 billion (yes Billion with a B) - more than the size of Sweden’s economy - were canceled for reasons still unknown in what was one of the biggest 'fat finger' trading errors of all time. Since then, US equity markets have suddenly become notably more volatile - and fallen significantly, VIX has seen odd intraday 'spikes', S&P futures saw the very odd 'satan signal', and USD/JPY has suffered its worst losses in 3 years. This raises the question of whether US market micro-structure is any better than Michael Lewis' Flash Boys' book describes.. (as we head into a bond market holiday, dismal liquidity, and a potential Black Monday), “That could absolutely happen here,” Tabb Group's Larry Tabb warns Bloomberg.
NDX approaching Long-term support and its Ending Diagonal trendline.
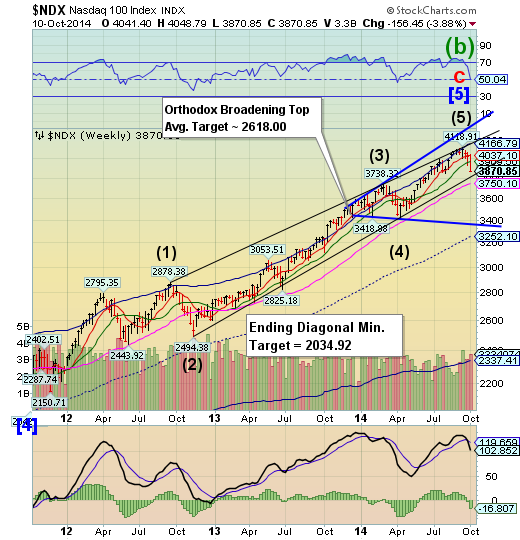
NDX continues its decline toward its Ending Diagonal trendline near 3800.00 and its Long-term support at 3750.10. Current analysis suggests the decline may reach or exceed mid-Cycle support at 3252.10, wiping out the entire gain of 2014.
(ZeroHedge) Present conditions create an urgency to examine all risk exposures. Once overvalued, overbought, overbullish extremes are joined by deterioration in market internals and trend-uniformity, one finds a narrow set comprising less than 5% of history that contains little but abrupt air-pockets, free-falls, and crashes.
"Abrupt market weakness is generally the result of low risk premiums being pressed higher. There need not be any collapse in earnings for a deep market decline to occur. The stock market dropped by half in 1973-74 even while S&P 500 earnings grew by over 50%. The 1987 crash was associated with no loss in earnings. Fundamentals don't have to change overnight. There is in fact zero correlation between year-over-year changes in earnings and year-over-year changes in the S&P 500. Rather, low and expanding risk premiums are at the root of nearly every abrupt market loss.
High Yield may be about to hit an air pocket.
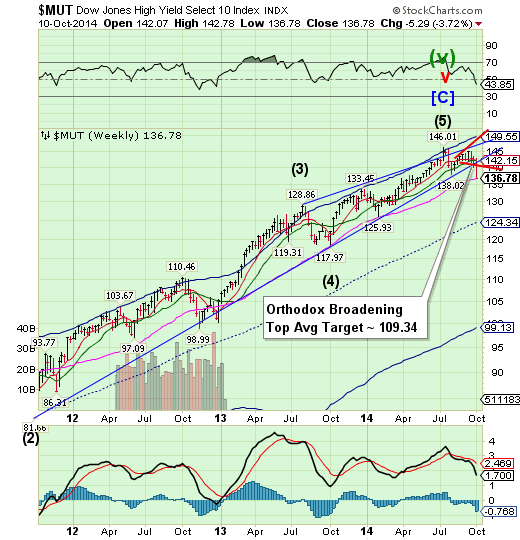
The High Yield Index, having broken beneath both the Ending Diagonal trendline and its Broadening Top formation, is now at its final support level at 136.74.A drop beneath this final support may trigger a cascading decline to the next support level between 117.97 and 124.34.If it doesn’t hold, pay attention to the Orthodox Broadening Top formation which forecasts a much lower outcome.
(ZeroHedge) The extended period of monetary accommodation and the accompanying search for yield are leading to credit mispricing and asset price pressures, increasing the chance that financial stability risks could derail the recovery.
Concerns have shifted to the shadow banking system, especially the growing share of illiquid credit in mutual fund portfolios.
Should asset markets come under stress, an adverse feedback loop between outflows and asset performance could develop, moving markets from a low- to a high-volatility state, with negative implications for emerging market economies.
The euro is now due for a bounce.
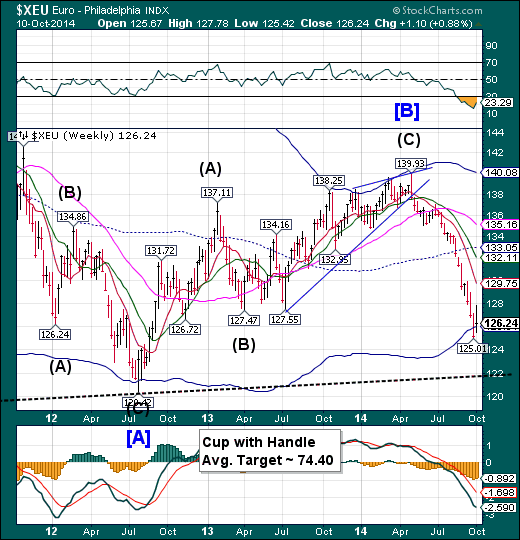
The Euro is due for a continuation of its bounce from its Cycle Bottom support at 126.01.The bounce may not last for more than another week, as it may still decline to the Lip of a Cup with Handle formation at 122.00 as the bounce may offer only a brief respite from the decline.
(ZeroHedge) The divergent prospects for growth, interest rates and monetary policies between the euro zone and the United States has led to a completely normal depreciation of the euro against the dollar, despite this depreciation being limited by the euro zone’s external surplus. Most observers are exuberant about this depreciation of the euro, but Natix is asks,faced with imports that the euro zone cannot do without (commodities, components manufactured outside the euro zone due to the segmentation of production processes), is it certain that it has a positive effect on euro-zone growth? Given the sensitivity of the euro zone's foreign trade (in volume terms and in terms of prices) to the euro's exchange rate, and at the historical link between the relative growth of the euro zone and the euro’s exchange rate, Natix is (devastatingly for the recovery-enthusiasts) find that the effect of a depreciation of the euro on euro-zone growth is very minor at best and, at worst, zero.
Euro Stoxx has broken through its Broadening Wedge.
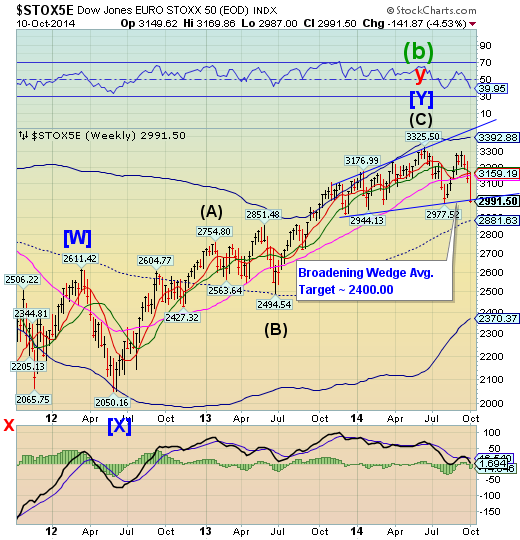
The EuroStoxx 50 Index fell through the trendline of its Broadening Wedge formation, which may trigger a panic decline to its Cycle Bottom at 2370.37. In all probability, EuroStoxx is likely to gain momentum to the downside this week. In addition, the Cycles Model suggests an important Cycle bottom in the following week.
(ZeroHedge) So now that Abenomics has officially failed in Japan (but will remain in place until Abe is ouster, either voluntarily as the local population has had enough of Japan's record inflation imports) what comes next? It is about to be tried in Europe of course, that other place where 5 years of unconventional monetary policy has masked the complete fiscal collapse and lack of reform of its member states, and as a result, nothing has improved except for a transitory bounce in stock prices, which recently hit record highs benefiting the 1% if only for a short period, with the hangover now is settling in and Germany's DAX back to a 1 year low.
The yen is chipping away at overhead resistance.
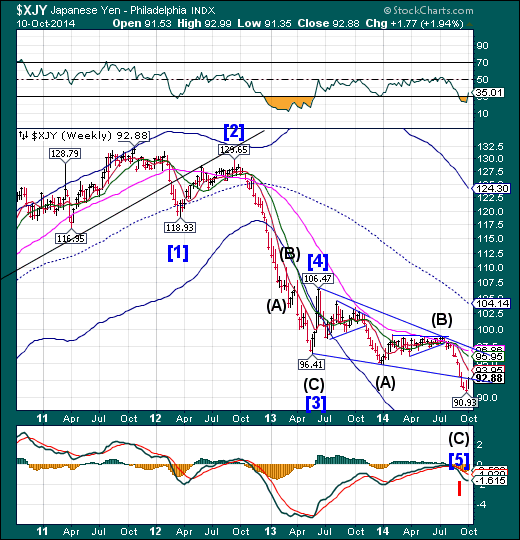
The Yen has made a second attempt to re-enter that Diagonal formation after making its Master Cycle low. The expected sharp reversal appears to be underway. This will have the effect of drying up the Yen carry trade which has been a major source of funding for the equities markets.
(CNBC) Bank of Japan Governor (BoJ) Haruhiko Kuroda says he's comfortable with the yen's recent deprecation, noting the currency is merely in the process of correcting from excessive strength.
The Japanese currency has lost over 6 percent of its value against the U.S. dollar over the past three months amid a strengthening greenback. Earlier this month, it briefly broke through the 110 threshold for the first time in more than six years.
"[The] exchange rate movements are not excessive so far," he told CNBC on Friday on the sidelines of the 2014 IMF/World Bank annual meetings in Washington DC.
The Nikkei may be challenging Long-term support.
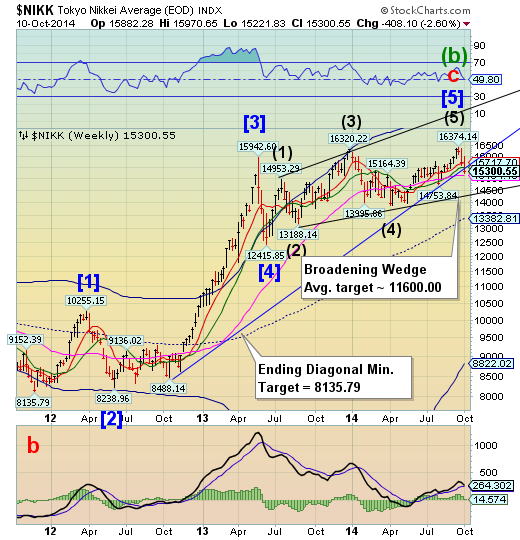
The Nikkei declined through its Ending Diagonal trendline to test Long-term support at 15134.19.A break beneath this level confirms the probable complete retracement of the rally that formed the Ending Diagonal over the past 3 years.A feedback loop may emerge between the declining Nikkei and the rising Yen as investors seek safe haven from the potential rout in stocks.
(NextBigFuture) Nomura Chief Executive Officer Koji Nagai predicted Japanese stocks will rally over the next six years as economic expansion fuels corporate profits.
The Nikkei 225 Stock Average (NKY) will climb to around 25,000 by 2020, up about 57 percent from today, the CEO of Japan’s biggest brokerage said at a forum in Tokyo. “Growth of Japan’s economy is assured until 2020 as it will benefit from development in Asia,” said Nagai
US Dollar tests its Head & Shoulders neckline.
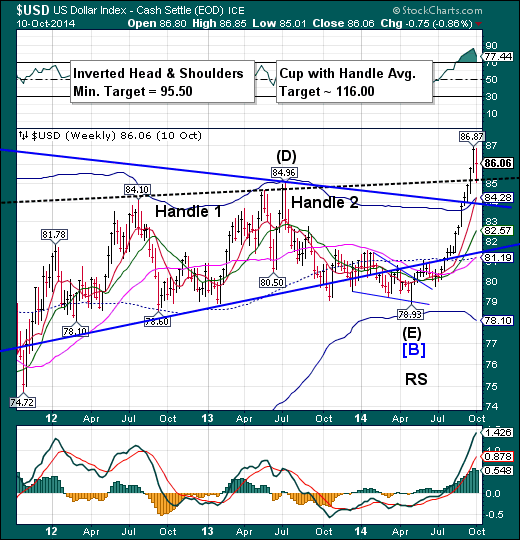
The US Dollar pulled back to its Head & shoulders neckline after breakingto new highs not seen since June of 2010.The Panic Rally may not yet be over as it is due for a panic high later this week. Panic buying may occur in an index when there is panic selling elsewhere.
(MarketWatch) — Investors will start finding out if a stronger U.S. dollar really dents quarterly results this week as earnings season ramps up with the financial sector providing the bulk of reports and a few key players in tech posting results.
Stocks are coming off another rough week with the Dow Jones Industrial Average DJIA, -0.10% off 2%, the S&P 500 Index SPX, -0.26% down 3%, and the NASDAQ Composite Index COMP, -0.10% sliding 4%.
USB approaches an important Anniversary.
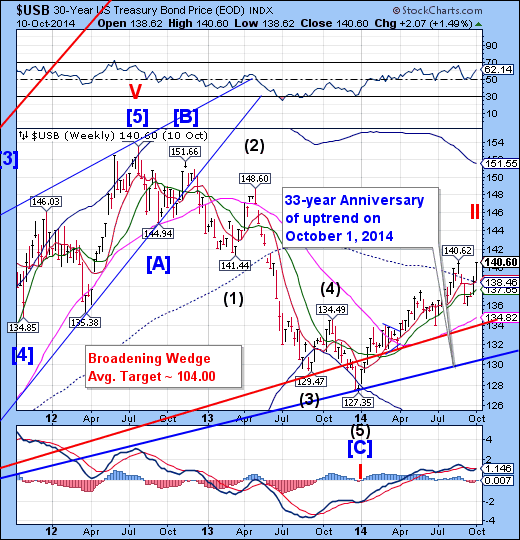
The Long Bond is due for a Primary Cycle high on Tuesday.The retracement has already reached the 50% level at 140.36 and may only need a nominal new high to be complete. Chances are now better-than even of an abrupt decline that may last through the end of October in which USB may break its 33-year old trendline.The potential target may be weekly Cycle Bottom support at 125.36. The final Master Cycle low may even occur at a much lower level during mid-November.
(Reuters) - The U.S. dollar fell against a basket of major currencies on Monday on persisting concerns about global economic growth and worries that the Federal Reserve may delay its first interest rate hike.
Concerns over the health of overseas economies continued in the wake of last week's weak German economic data and the International Monetary Fund's cut to its global growth forecast. Meanwhile, Fed officials said on Saturday that a slowdown in the global economy could hamper a tightening of U.S. monetary policy.
Gold bounces at the Cup with Handle line.
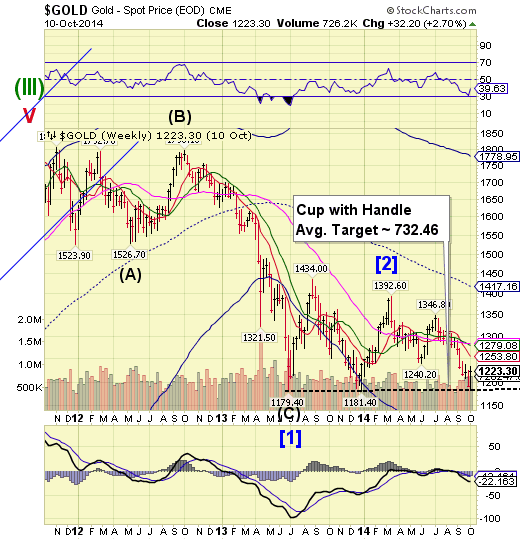
Gold made a Trading Cycle low at the Lip of its Cup with Handle formation at 1183.30 this past Monday. Because gold bounced at a higher low than last December, investors are heaving a sigh of relief.The bounce may last a few more days, but a Panic cycle low may be due in early November.
(FoxBusiness) Gold rose on Monday as the dollar fell on uncertainty about how soon the Federal Reserve will raise interest rates and worries about the global economy reduced investor appetite for risk.
Spot gold rose to a near four-week high of $1,237.30 an ounce and was trading up 0.4 percent at $1,227.75 at 1353 GMT. It posted its biggest weekly gain in four months last week, up 2.7 percent. U.S. gold futures hit their highest since Sept. 17 at $1,238 an ounce earlier.
The metal has rebounded four percent from a 15-month low of $1,183.46 hit last week after strong U.S. jobs data fueled talk that U.S. interest rates could rise sooner rather than later.
Crude at the lowest price since July 2012.
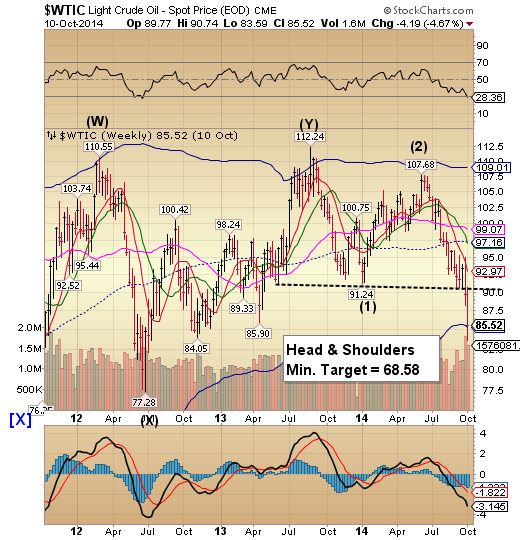
Crude declined through its Cycle Bottom support at 85.31and may continue its decline through the week of October 20.The decline may give new meaning to the word “oversold.”
(CNBC) Crude weakened on Monday, with U.S. oil closing at its lowest in nearly 2 years, as Kuwait said OPEC is unlikely to cut output to support prices and Saudi Arabia privately told oil markets that it is ready to accept oil prices perhaps down to $80 a barrel.
U.S. front-month November crude futures shed 8 cents to settle at $85.74, paring earlier steep losses but closing at its weakest since December 2012. Brent Oil declined by more than 1 percent to under $89.
China may have hit its high on Thursday.
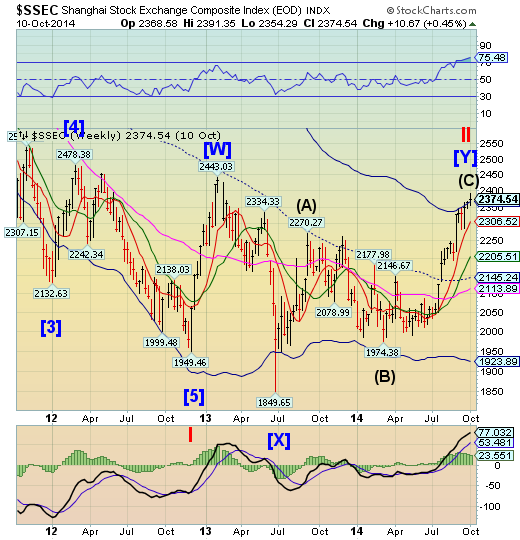
The Shanghai Index vaulted above its Cycle Top at 2366.59 on Thursday in what may have been its Primary Cycle high.There is no reversal pattern yet, but Primary Cycles are very timely.There is another significant Cycle Pivot due on October 13, which could confirm the reversal. Because this Cycle is so exaggerated, the reversal may be even more awe-inspiring than the rally as it declines into its next Cycle low.
(ZeroHedge) Late into Friday's major market selloff, a completely unfounded rumor emerged out of nowhere, seeking to rekindle the BTFD spirits, that with central bank intervention from both the BOJ and ECB already priced in, and with the Fed still in taper mode (if not for much longer should the S&P dump accelerate), that the last central-planner wildcard, China, would join the fray and a major monetary gusher would come out of Beijing over the weekend to halt the slide. Alas, we have bad news for said BTFDers: just hours before futures are set to open on Sunday afternoon, the chief economist at China’s central bank said Saturday that he doesn’t see any reason for large-scale fiscal or monetary stimulus “in the foreseeable future” despite slowing growth in the world’s second-largest economy and disagreements about the depth and timing of economic overhauls.
The Banking Index may have broken its Broadening Wedge.
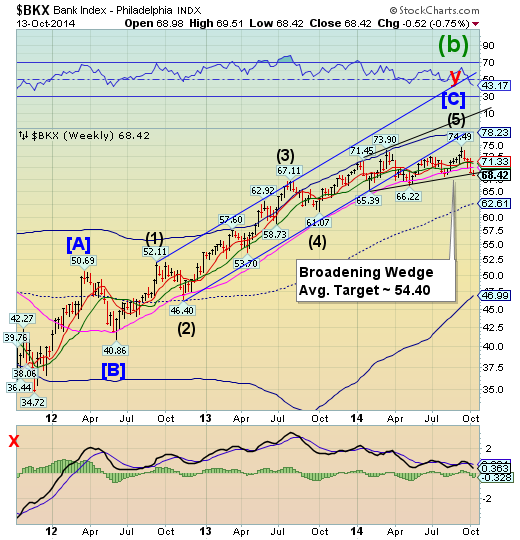
--BKX appears to have declined through the lower trendline of its Broadening Wedge.The consequences of a violation ofthe Broadening Wedge trendline may bring on a panic decline that could last through late October or early November.
(ZeroHedge) We have been discussing the widespread belief in "the narrative of central bank omnipotence" for a number of months (here and here most recently) as we noted "there are no more skeptics. To update Milton Friedman’s famous quote, we are all Bernankians now." So when Saxobank's CIO and Chief Economist Steen Jakobsen warns that "the mood has changed," and feedback from conference calls and speaking engagements tells him, there is a growing belief that the 'narrative of the central banks' is failing, we sit up and listen.
Disclaimer: Nothing in this email should be construed as a personal recommendation to buy, hold or sell short any security. The Practical Investor, LLC (TPI) may provide a status report of certain indexes or their proxies using a proprietary model. At no time shall a reader be justified in inferring that personal investment advice is intended. Investing carries certain risks of losses and leveraged products and futures may be especially volatile. Information provided by TPI is expressed in good faith, but is not guaranteed. A perfect market service does not exist. Long-term success in the market demands recognition that error and uncertainty are a part of any effort to assess the probable outcome of any given investment. Please consult your financial advisor to explain all risks before making any investment decision. It is not possible to invest in any index.
