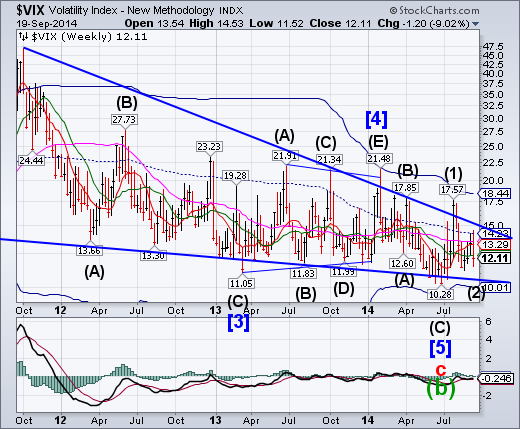
The VIX challenged weekly mid-Cycle resistance at 14.23 this week before completing what appears to be an irregular Intermediate Wave (2).The largest move down occurred on the same day it made its high, Wednesday after the FOMC announcement.
SPX breaks higher for quadruple witching.
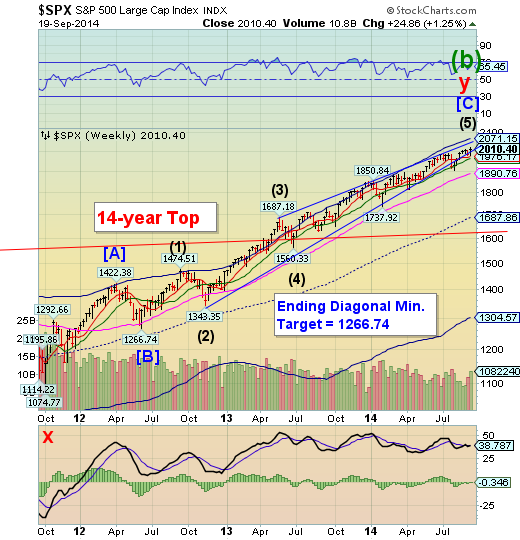
The SPX closed positive for quadruple witching this week just in time to pay off institutional options, futures and options on futures.Last week’s testing of the lower trendline of the 3-year long ending Diagonal was only the second timeinthat entire period. Technical analysis suggests that an Ending Diagonal will be completely retraced, once broken. Elliott Wave analysis suggests that an Intermediate Wave (1) decline will exceed its Intermediate Wave (4) low of the rally in a change of trend.
ZeroHedge: Based on the unprecedented collapse in trading volumes of cash products over the past 6 years, one thing has become clear: retail, and increasingly, institutional investors and traders are gone, probably for ever and certainly until the Fed's market-distorting central planning ends. However, one entity appears to have taken the place of conventional equity traders: central banks.
Courtesy of an observation by Nanex's Eric Hunsader, we now know, with certainty and beyond merely speculation by tinfoil fringe blogs, that central banks around the world trade (and by "trade" we meanbuy) S&P 500 futures such as the E-mini, in both futures and option form, as well as full size, and micro versions, in addition to the well-known central bank trading in Interest Rates, TSY and FX products.
NDX makes its Alibaba high.
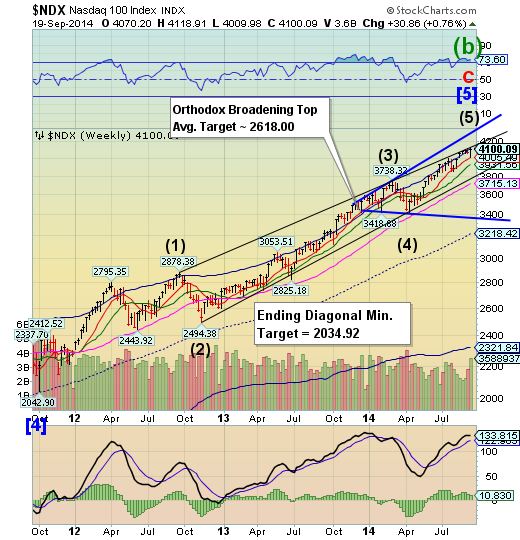
The NDX tested its weekly short-term support this week before making a new high. The wider trading range may be a prelude to a breakdown, since NDX Volatility also made a 25% round trip last three weeks.
(ZeroHedge) As business media pats itself on the back for the BABA IPO, proclaiming how it's the most important, and biggest IPO of all-time and on "the most efficient and transparent" exchange, perhaps it was just oversight that they forgot to mention BABA's 7-second halt "glitch" this afternoon as BABA trading exceeded 25% of all volume at some points. But that was minor compared to the utter clusterfuck that occurred as AAPL shares started to tumble and, as Nanex points out, 100s of individual stocks instantly flash-crashed and dashed by over 1% at 1550ET as the Russell rebalanced. These are your unrigged, transparent, efficient markets...
High Yield Flagging.
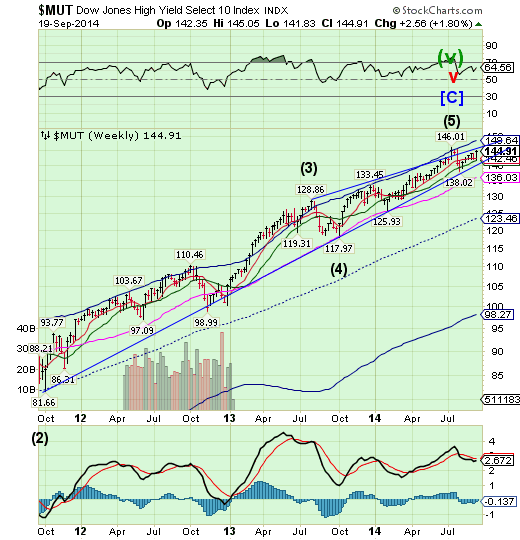
The High Yield Index failed at its attempt to better its July 3 high this week as it found support at its weekly Intermediate-term level at 142.48. This is often the high point of the month, so a further violation of support puts the uptrend in jeopardy.
(ZeroHedge) It appears today's weakness in stocks (most notably high-beta momo) and bonds (HY credit weakness) was triggered by two "ma"s - grandma Yellen and grand-poohbah BABA's Ma. Hawkish FOMC concerns took the shine off HY credit (and stocks) but Treasury bonds rallied modestly (5Y -3bps, 10Y -2bps). However, high-beta momo stocks dragged Nasdaq and Russell lower as 'smart money' proclaimed this was making room for the Alibaba IPO (which raises the question - if there is so much pent-up demand money on the sidelines just dying to be lost in the stock market, then why were so many high-beta, high-growth, momo names being sold today, theoretically in order to make room for the BABA IPO?)
The Euroappraochessupport.
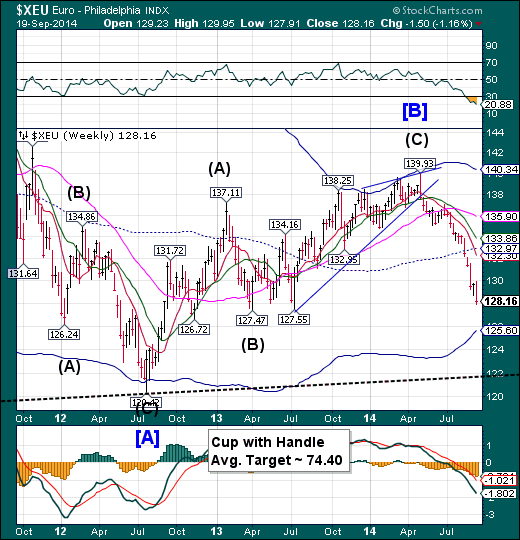
The euro decline is approaching the origin of its Ending Diagonal formation at 127.55, where it may find its next support.There is a major Cycle Pivot on Tuesday, where the Euro may bounce. The question is, will it find support at the bottom of its Diagonal formation or at Cycle Bottom at 125.60?
(Bloomberg) The European Central Bank may not need to add stimulus measures after steps in the past three months pushed down the euro, said Governing Council member IgnazioVisco
“Inflation expectations have to be back where they were,” Visco said in an interview in Cairns, Australia, where he is attending a meeting of Group of 20 finance chiefs. “This doesn’t mean that there will be a next step. We have been bold enough to reduce interest rates to a level that was unexpected to the market.”
EuroStoxx reverses with no new high.
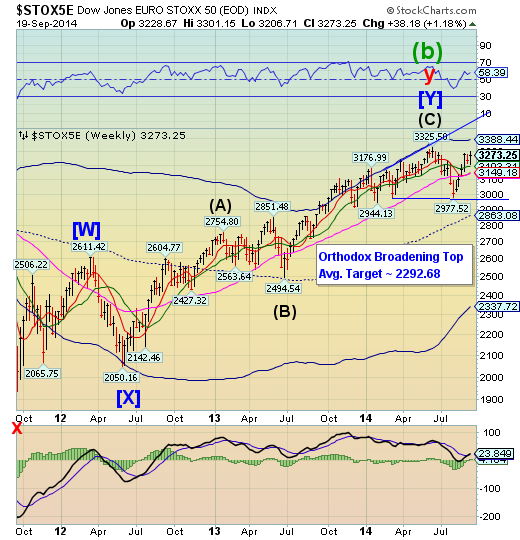
The DJ Euro Stoxx 50 Index failed at its attempt to make a new highs this week. The first level of support is the Weekly Intermediate-term support at 3183.34. The loss of support at the weekly Long-term level at 3149.18 leaves the Broadening Top formation in sight, whichanticipates a much deeper target, where the Cycle Bottom at 2337.72may be pierced. In addition, the Cycle Model suggests no potential relief bounce until late October.
(Businessweek) European stocks rose as Scotland voted to reject independence from the U.K., while the regional benchmark index failed to hold on to a 6 1/2-year high amid the expiry of derivative contracts.
he Stoxx Europe 600 Index gained 0.2 percent to 348.52, after earlier rallying as much as 0.9 percent. The number of shares changing hands in the gauge’s companies was more than double the 30-day average for this time, according to data compiled by Bloomberg. The U.K.’s FTSE 100 Index advanced 0.3 percent.
“It’s a risk-on day,” Richard Champion, chief investment officer of Sanlam Private Investments (U.K.) Ltd., which manages $4 billion, said by telephone in London. The Scottish referendum “is one more thing investors don’t have to worry about. A ‘yes’ vote would’ve caused uncertainty for the European and U.K. markets. In continental Europe, we have loose monetary policy that will be supportive for shares.”
The Yen “throws under” its Ending Diagonal trendline.
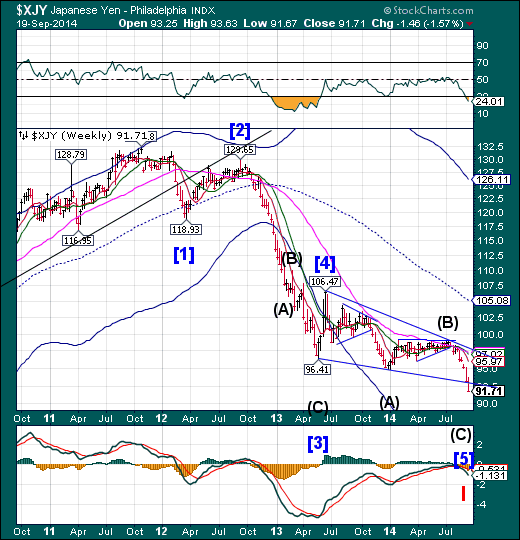
The Yen continued to extend its decline into its Master Cycle low with a “throw under” beneath its Ending Diagonal trendline. The next probable Pivot day is Tuesday, as the decline appears to be in the final stage of its Ending Diagonal. The double Triangles doubly forecast the end of the decline. This would have the effect of drying up the Yen carry trade which has been a major source of funding for the equities markets.
(WSJ) Japan is getting less bang from the rising buck.
That is the message investors are sending after a month in which the yen broke out of a tight trading range and slipped to a six-year low against the dollar. The Nikkei 225 Stock Average has risen in tandem, gaining 1.1% on Thursday to stand at an eight-month high.
The moves in currencies and stocks look considerably different from the market jolt that started in late 2012, shortly before Shinzo Abe became prime minister on an antideflation platform.
Then, stocks surged 80% in six months and investors celebrated a 23% drop in the yen, triggered by the monetary easing of Mr. Abe's handpicked Bank of Japan governor, Haruhiko Kuroda.
The Nikkei makes a new multi-decade high.
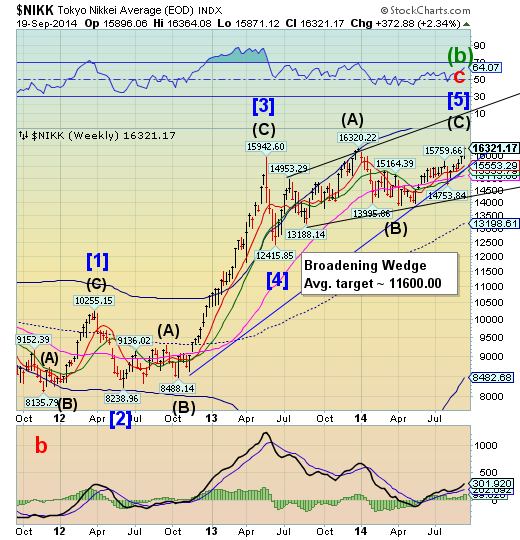
The Nikkei made a new multi-decade high while at the same time that the Yen extended its low.The Yen and the Nikkei continue their polar opposite relationship for the time being. Will the reversal in the Yen also bring the reversal in the Nikkei?
(WSJ) Stocks rose to an eight-month high in Tokyo but retreated in Hong Kong on Thursday, with the prospect of higher U.S. interest rates and a weak Chinese property market in focus.
The Nikkei Stock Average rose 1.1% to 16067.57, the highest level since January, as the U.S. dollar traded at ¥108.66, a new six-year high, compared with ¥107.26 the same time Wednesday. A weaker yen helps Japanese exporters.
U.S. Dollar is approaching a breakout.
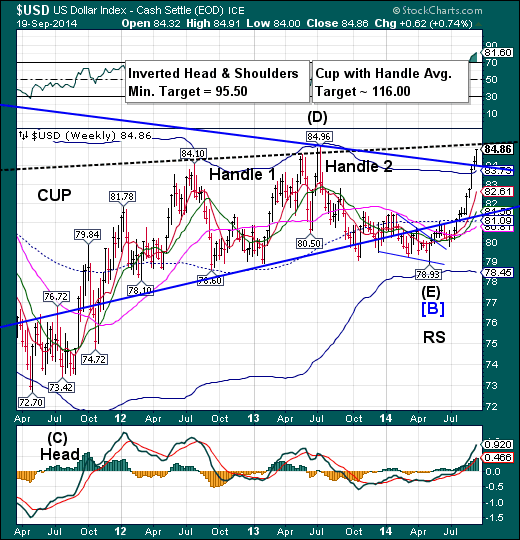
The US Dollar closed within 10 ticks of its 2013 high at 84.96.The question is, does the Dollar break through its Head & Shoulders neckline or does it pull back for a 2-3 week respite? The Cycles Model is unclear as yet.
(Reuters) - The dollar gained against a basket of major currencieson Friday, posting its 10th consecutive week of gains, as investors bet U.S. interest rates would rise more quickly than had been expected.
Some market participants, however, said the dollar's move was overdone and its rally should pause fairly soon. Fundamentally, the dollar seemed to be getting just a marginal boost from positive U.S. economic news, they added.
"I just think we've come a long way very quickly here and the dollar doesn't seem to be getting incremental support from positive developments," said Shaun Osborne, chief currency strategist at TD Securities in Toronto.
USB approaches an important Anniversary.
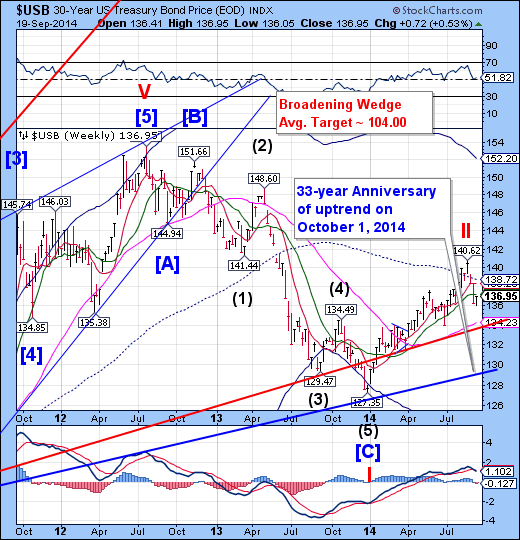
The Long Bond retested Intermediate-term support at 137.22on Friday. A failure of the retest may send USB to the next support at 134.23 or lower. Chances are now better-than even of an abrupt decline that may last through the end of September in which USB may break its 33-year old trendline.The potential target may be weekly Cycle Bottom support at 125.02. The final Master Cycle low may occur at a much lower level during the week of November 10.
(NASDAQ) U.S. Treasury bonds rallied Friday to end the week on a strong note as investors took advantage of recent selloff to buy debt at cheaper prices.
The benchmark 10-year note was 11/32 higher, yielding 2.589%. Yields fall as prices rise.
The yield fell by 0.02 percentage point this week, following last week's jump of 0.15 percentage point, the biggest weekly increase in a year.
Gold continues itsdecline.
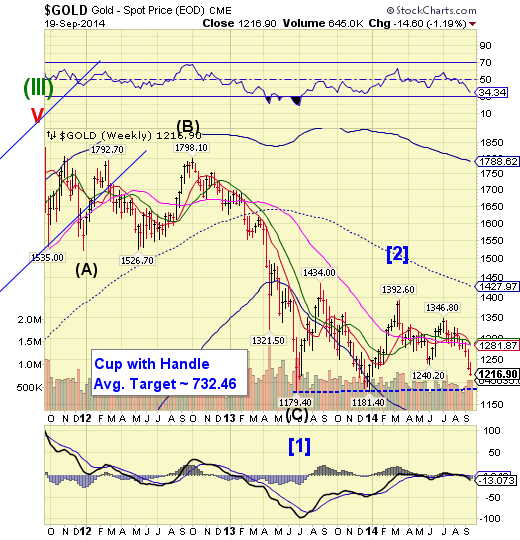
The decline in goldcontinued toward the Lip of its Cup with Handle formation at 1181.40 after a breakdown beneath 1240.20. The current decline may not be complete until late September or early October. Gold is in free-fall territory again.
(WSJ) old settled at its lowest close of the year and other precious-metals prices tumbled Friday, as a surging dollar and expectations of higher interest rates spurred investors to sell.
Silver prices fell 3.6%, its biggest daily drop in nine months, as investors looked for higher-yielding assets elsewhere.
"Cash is flowing to the dollar, the U.S. stock market and the U.S. bond market, and out of precious metals," said Peter Hug, global trading director at Kitco Metals. "You get the feeling that (precious metals) investors have just given up."
Crude retests its neckline.
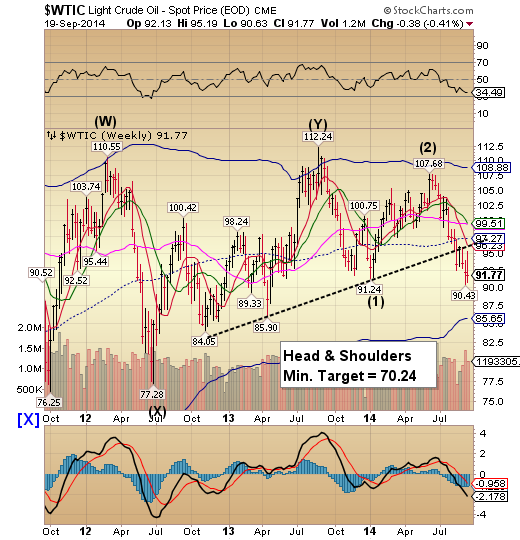
Crude retested its Head & Shoulderneckline at 96.23 this week, but failed to reach it.It now appears ready to decline to its weekly Cycle bottom at 85.65 in the next week.It may bounce for several weeks at that level, also reflecting possible rising global tensions.
(WSJ) U.S. and global oil prices diverged Friday as supply concerns weighed on U.S. prices, though both contracts posted slight gains for the week.
Light, sweet crude for October delivery settled down 66 cents, or 0.7%, to $92.41 a barrel on the New York Mercantile Exchange. Prices rose 0.2% this week.
Brent rose 69 cents, or 0.7%, to $98.39 a barrel on ICE Futures Europe and rose 0.4% on the week.
China extends its retracement to the weekly Cycle Top.
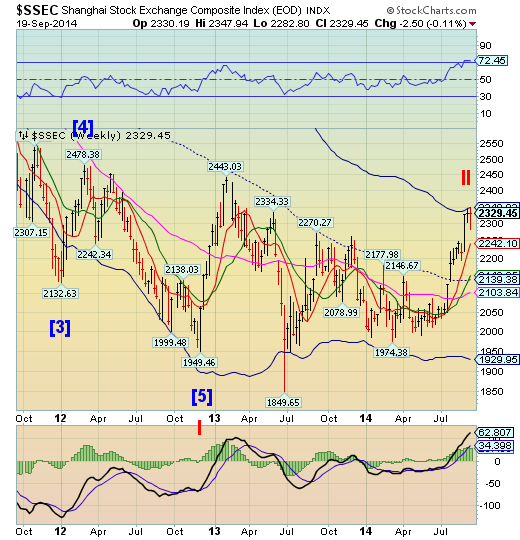
The Shanghai Indexmade its final high on Monday (as suggested last week), challenging its Cycle Top at 2348.82.It made a reversal pattern which can be confirmed early next week.The reversal may be even more awe-inspiring as it declines into mid-to-late October.
(ZeroHedge) While the rest of the world is focused on what any given "developed" (or Chinese) central bank will do to continue the relentless liquidity-driven rally to new record highs, China has bigger problems as it continues to scramble in its attempts to figure out how to halt the slow motion housing crash that has now firmly gripped the nation. So firmly, that according to overnight data from the National Bureau of Statistics, monthly house prices dropped in some 68 of 70 tracked cities, the most in over three years, since January 2011 when the government changed the way it compiles the data.
The Banking Index makes a new high.
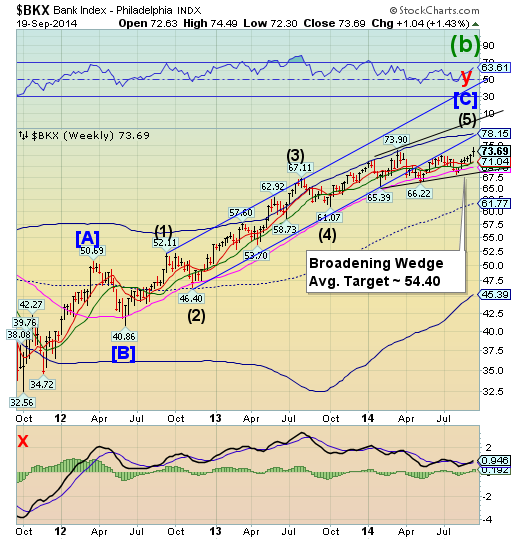
BKX extended its rally for yet another week, making a new Primary Cycle high.A decline to the Broadening Wedge trendline at 68.00 may bring on a panic decline hat could last through late October.
(ZeroHedge) As part of Draghi's attempt to reflate the ECB's balance sheet by €1 trillion, a key variable was the extension of the LTRO (1&2) program, in the form of the Targeted LTRO, or TLTRO aka LTRO 3 & 4, whose initial take up results were announced earlier today. It was, in a world, a flop. Because while the consensus was for European banks to take anywhere between €100 and €300 billion in nearly zero-cost credit from the ECB (at 0.15%) to engage in carry trades in today's first round TLTRO operation (ahead of the second TLTRO in December), moments ago the ECB announcedthat banks, which had already been actively paying down the first two LTRO carry programs, of which only €385 billion had been left of over a €1 trillion total at inception, were allotted a tiny €82.6 billion across 255 counterparties.
(ZeroHedge) The good news is that the rigging of the FX markets - now conspiracy fact, not conspiracy theory - has, according to Bloomberg, forced the world’s biggest banks to overhaul how they trade currencies to regain the trust of customers and preempt regulators’ efforts to force changes on an industry tarnished by allegations of manipulation with the "modernization of processes that probably should have been brought in 15 or 20 years ago." However, the FX market is far from 'clean' as Bloomberg notes, while banks can limit access to details about client orders on their computer systems, they can’t keep employees from talking to one another. Some traders also are still communicating with clients and counterparts at other firms via Snapchat, circumventing their company’s controls right under the nose of the SEC. As one trader commented, "these [reform] changes look like fig leaves."
(ZeroHedge) With the Ruble hitting record lows once again today against the USDollar, it appears concerns over USD liquidity are growing in Russia. The Russian central bank has unveiled an FX swap operation, allowing firms to borrow dollars in exchange for Rubles for a duration of 1 day (at a cost of 7%p.a.). Of course, this squeeze on USD funding - driven by Western sanctions - will, instead of isolating Russia, force Russian companies (finding USD transactions prohibitively expensive) into the CNY-axis, thus further strengthening the Yuanification of world trade and the ultimate demise of the USD as reserve currency.
