Get 40% Off
🤯 Perficient is up a mind-blowing 53%. Our ProPicks AI saw the buying opportunity in March.Read full update

SPX And SPY: The Weekly Charts Matter

Published 09/13/2016, 03:03 PM
Updated 07/09/2023, 06:31 AM

What Once Was Resistance

Given the market’s near addiction to low interest rates and recent price action, it is helpful to get some guideposts based on the expression:

What once was resistance may now act as possible support.

The expression above includes two key words: “may” and “possible”, meaning there is no market law bounding price to act in any particular manner at any particular level. However, we know markets often retest breakout levels or areas of past resistance.

S&P 500 Weekly

Weekly charts can help us zero in on the most important levels. The weekly chart of the S&P 500 below shows, prior to the recent bullish breakout, sellers became more active between 2,096 and 2,122. If those levels are taken out on a weekly basis, our concerns would increase with a weekly close below the Brexit low of 2,037.
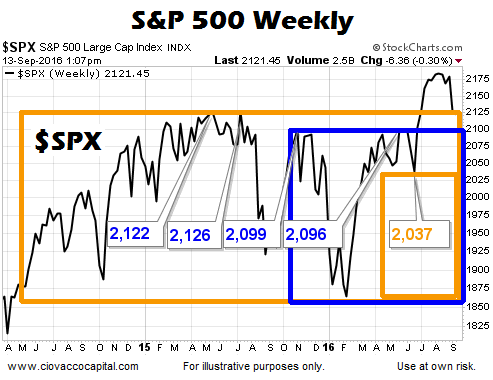
Weekly S&P 500

Weekly charts print only one price each week. Therefore, intraweek moves are not as relevant as the close for the week.

SPY (NYSE:SPY) Weekly

The weekly chart of the S&P 500 ETF below shows, prior to the recent bullish breakout, sellers became more active between 207.46 and 209.15. If those levels are taken out on a weekly basis, our concerns would increase with a weekly close below 202.91.
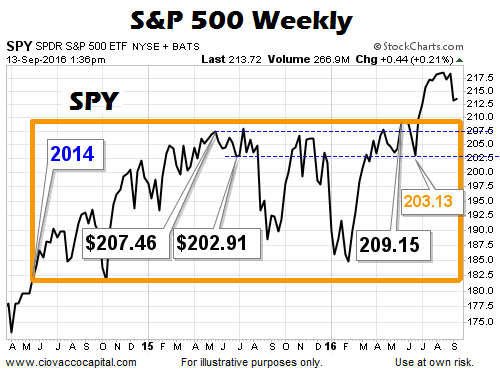
Weekly SPDR S&P 500

Prudent To Respect All Outcomes

While the longer-term outlook has not deteriorated in a significant manner yet, as outlined on September 9 and September 12, recent volatility and the near-term economic calendar tells us to respect any and all outcomes. With two economic reports -- PPI and CPI -- related to inflation on this week’s docket, the market will be watching closely. If there is one thing that can force the Fed’s hand on interest rates, it's a surprising pop in inflation. Our ETF scoring system tells us our positions are a bit more vulnerable, but the facts have only moved into a “pay-closer-attention” zone at this time.

3rd party Ad. Not an offer or recommendation by Investing.com. See disclosure here or remove ads .

Latest comments

Risk Disclosure: Trading in financial instruments and/or cryptocurrencies involves high risks including the risk of losing some, or all, of your investment amount, and may not be suitable for all investors. Prices of cryptocurrencies are extremely volatile and may be affected by external factors such as financial, regulatory or political events. Trading on margin increases the financial risks.
Before deciding to trade in financial instrument or cryptocurrencies you should be fully informed of the risks and costs associated with trading the financial markets, carefully consider your investment objectives, level of experience, and risk appetite, and seek professional advice where needed.
Fusion Media would like to remind you that the data contained in this website is not necessarily real-time nor accurate. The data and prices on the website are not necessarily provided by any market or exchange, but may be provided by market makers, and so prices may not be accurate and may differ from the actual price at any given market, meaning prices are indicative and not appropriate for trading purposes. Fusion Media and any provider of the data contained in this website will not accept liability for any loss or damage as a result of your trading, or your reliance on the information contained within this website.
It is prohibited to use, store, reproduce, display, modify, transmit or distribute the data contained in this website without the explicit prior written permission of Fusion Media and/or the data provider. All intellectual property rights are reserved by the providers and/or the exchange providing the data contained in this website.
Fusion Media may be compensated by the advertisers that appear on the website, based on your interaction with the advertisements or advertisers.
© 2007-2024 - Fusion Media Limited. All Rights Reserved.