- Monitoring purposes SPX: Neutral
- Monitoring purposes GOLD: Short GDX on 8/22/16 at 29.46.
- Long-Term Trend monitor purposes: Short SPX on 1/13/16 at 1890.28

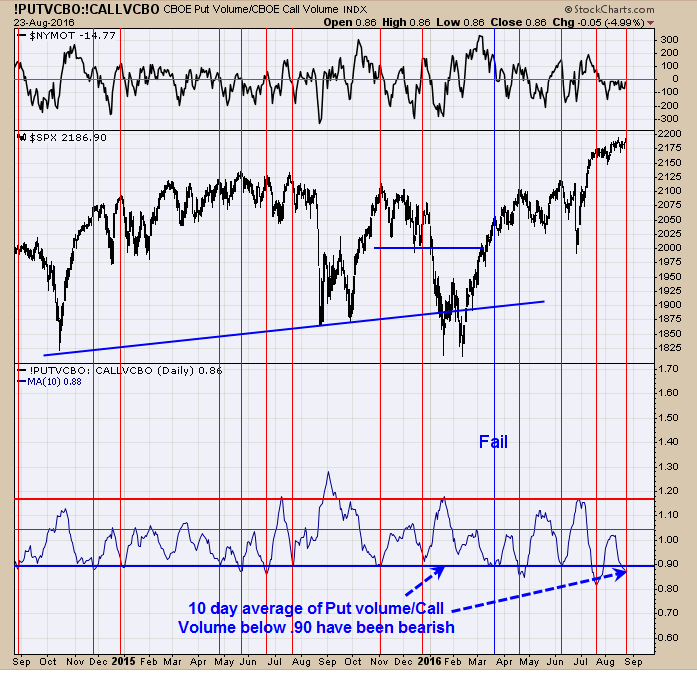
Yesterday we showed the 10-period average of the OEX put/call ratio and readings below 1.20 have been bullish for the market and it closed at .95 and the lowest reading since last October. The above chart is the 10 day average of the put volume/call volume ratio and readings below .90 have been bearish for the market and today’s reading came in at .86. So which option ratio is Right? We are saying both are right in that no big move up or down is in the cards right now. However a move of 2% is possible in the coming day and not more. Short term the market could push to 220 on the SPY (NYSE:SPY) and find resistance. What happen from there depends what the indicators say.

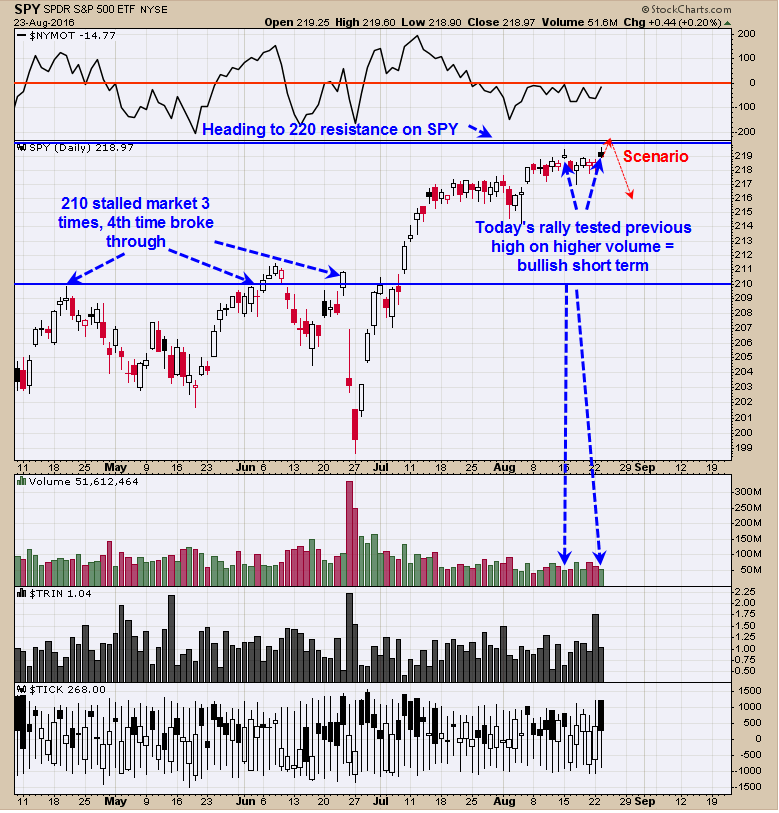
Timer Digest has the Ord Oracle (NYSE:ORCL) ranked 9th in performance for the last 12 months updated 8/20/16. Round numbers for SPY can produce short term resistance levels. It took four tries to get through the 210 level on the SPY and now SPY is attempting to test the 220 level which also should provide resistance on the first test. Today’s rally tested the previous minor high of August 15 and that test came on higher volume which is bullish for short term and implies today’s high will be exceeded at some point. Right above today’s high is the 220 level which should provide resistance. In previous instances when market tested a round number the market backed off 2% or more before trying again to testing the round number. A test of today’s high could lead to clues of what is coming next. According to Seasonal charts a top should form in late August to early September which could produce a decline into October to November. Still neutral for now.

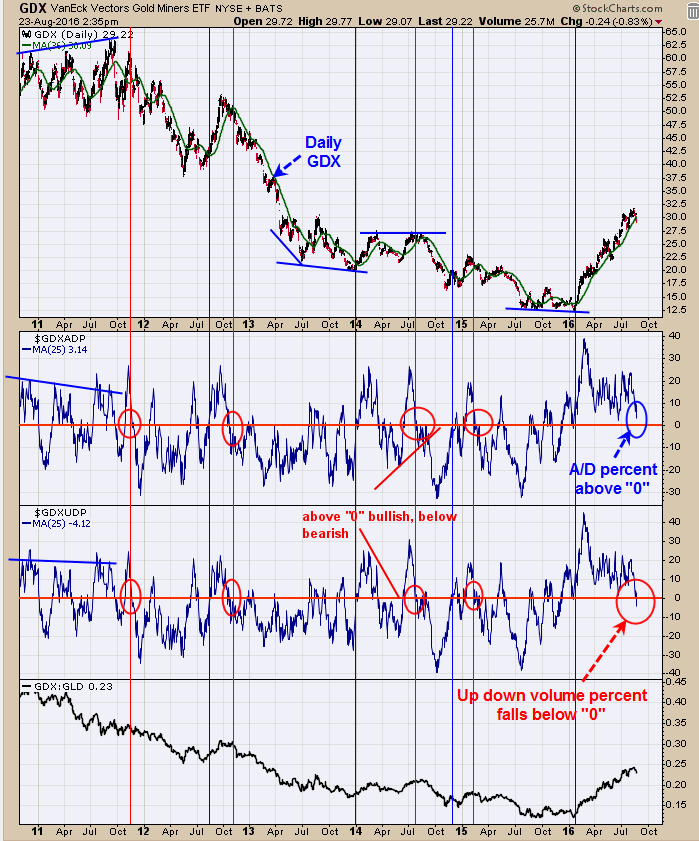
The second window up from the bottom is the Up and down volume percent for the stock in VanEck Vectors Gold Miners (NYSE:GDX), which is updated about an hour after the close. The reading of -4.12 is from yesterday’s close. Since this reading fell below “0” a bearish signal is triggered on this indicator. Next window up is the advance/Decline Percent for stocks in GDX. This indicator is also updated about an hour after the close and the reading of 3.14 reflects yesterday’s close. Since GDX was down yesterday we where expecting both indictors to fall below “0” and one did and the other last ground but held above “0”. Notice that both indicators have been trending down over the last week showing weakness. We are expecting both indicators to weaken further in the coming days. The red vertical lines show when both Up and down volume % and A/D % closed below “0” which trigger a sell signal. Today’s GDX weakness may have pushed A/D % below “0” and complete the sell signal for this method. With the Bullish Percent index falling below the July low yesterday we anticipated further weakness in GDX and triggered our sell signal yesterday. We are short the GDX on 8/22/16 at 29.46, possible target from 26.00 to 22.00 range.
