
Three doji days in a row, and yet the S&P 500 action is telling. After breaking above the mid-June highs, Friday's close is within spitting distance of the June 8 top. And stocks are primed to overcome it.
It's because they've been consolidating below the resistance without dropping lower meaningfully. While the sentiment has turned greedier, it's still a shadow of the pre-corona days. For the week just in, there is 31% bulls, 45% bears and 24% neutral (AAII data) – hardly a screaming picture of all-out greed.
Too many expect a bearish outcome along the double top lines – and there is no shortage of negative catalysts waiting in the wings. But the bets on new stimulus and unemployment impact softened are winning the day. What's the best black swan indicator anyway? Sharply rising USDX – and look where it is instead. Gold isn't getting sold off – there is no liquidity crunch present.
I also look at the healthy rotation into value stocks – into beaten-down sectors – amid the froth being taken off in technology. But given the strong leadership from semiconductors, tech is still favored to join the party sooner than those looking at the P/E ratios think. Yes, rotation is what bull markets are made of.
S&P 500 in the Medium- and Short-Run
I’ll start today's flagship Stock Trading Alert with a weekly perspective (please visit this free article on my home site where many more charts are featured).
The rebound off the 50-week moving average goes on as the S&P 500 extended gains in the past week. While the weekly volume isn't outstanding, it's still a tad higher than was the case a week ago.
The sizable lower knot of the week just in, got us the hanging man candlestick. That's a bearish pattern indicating exhaustion of the buyers, but considering everything covered in today's analysis, I wouldn't trust it.
Next comes the daily chart (charts courtesy of http://stockcharts.com ):

The blue resistance based on mid-June tops has turned into support, and the index is undergoing a healthy consolidation close to the early June highs.
Stocks are just taking their time, in line with my Thursday's thoughts about the potential double top and the selling nearby:
(…) the pressure to go higher is building under the surface in my opinion. I says so because should the bears be willing to sell heavily in the 3220-3230 zone (potential double top area), they would have done so – the fact they haven't been willing to push prices materially lower, is telling by itself.
Yes, the volume behind the upswing off the late June lows hasn't been outstanding, but only prices falling sharply and preferably also on rising volume, would make it a double top.
Prices consolidating just below are a show of latent strength to me. And even more so when I look at the credit markets.
The Credit Markets’ Point of View
The action in high yield corporate bonds (HYG ETF) is growing increasingly supportive. Friday's doji formed at a higher level, and on increasing volume compared to Thursday. I wouldn't be surprised to see it carry over into Monday's session – the swing structure and indicators support more gains to come.
And so do the ratios – both investment-grade corporate bonds (LQD:IEI) and high yield corporate bonds (HYG:SHY) keep pointing the same way. Their path of least resistance being undeniably higher, is in tune with more stock gains.

Looking at Friday's dynamic alone, the high yield corporate bonds to short-term Treasuries (HYG:SHY) ratio is gently pushing the overlaid S&P 500 closing prices (black line) to rise. There are no new sudden dislocation striking the eye – the relative momentum in both, is intact. The upswing is merely taking time, and the charts don't scream danger.
S&P 500 Sectors in Focus
The talk of the tech bubble has helped to take off some froth from the sector with P/E ratios at nosebleed levels. Technology (XLK ETF) isn't breaking down, just looking for a short-term direction in its newfound trading range. It's more likely than not it would eventually break out higher, and timing is the only question as the continuing outperformance in semiconductors (XSD ETF) foretells.
I view this as a healthy development, and even more so given that the tech money isn't leaving the stock market, but moving into other plays. Considered undervalued, or taking the baton, the rotation's winners are many.
Three-star performers come next. Healthcare (XLV ETF) is taking initiative after a prolonged consolidation following an even sharper rebound off the March 23 lows than technology enjoyed. Materials (XLB ETF) are also on fire – and little surprise given the massive money printing. Last but not least, consumer discretionaries (XLY ETF) are also making new 2020 highs.
Even the defensive plays (utilities and consumer staples – XLU ETF, XLP ETF respectively) are seeing gains as market players seek undervalued stock assets instead of moving to the sidelines.
It's been on June 5 precisely, when I made the coming inflation a central theme of the stock bull run in the article Reaping the Early Benefits of Inflation in Stocks. Yes, both the monetary and fiscal stimulus is overweighing the corona shocks that I covered extensively on April 12 in the article S&P 500 in the Aftermath of Fed's $2.3T Backstop.
It's not until we see inflation on the ground making a return that the stock bull would become endangered. The stimulus (existing and in the pipeline) is powerful enough to keep overwhelming the corona aftershocks (and unless lockdowns get out of hand again, the newly incoming shocks too) for a good more than a few months to come.
Corona Panic and Reality
A parting factual look at the corona deaths beyond the CDC-provided declining weekly figures that I featured in the July 9 article The Renewed S&P 500 Upswing Is Coming. Let's see this comparison (chart courtesy of Lew Rockwell and Zero Hedge) between the Spanish flu that killed an estimated 50-100 million worldwide and corona.
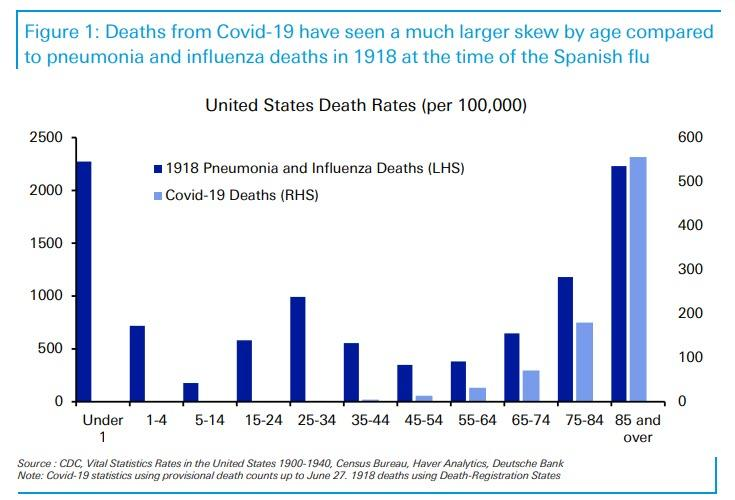
Tell me, which one was more deadly and dangerous? The country was at war, and there were no lockdowns, and the ability to make a living wasn't crippled. People just strove to be productive and were responsible for doing so.
Summary
Summing up, the S&P 500 is ready for more gains, and the sentiment isn't excessively greedy as the put/call ratio shows. Smallcaps (IWM ETF) are joining in, emerging markets (EEM ETF) are doing great, and the healthy rotation within S&P 5000 sectors is on. The dollar again rolled over as I called for it to do, pointing out that the shelf life of whatever disturbances (think China, corona fear politics) is probably very temporary.
The following verbatim quote from my Friday's summary rings true also today. Yes, I think the 3230ish area will be overcome – and I say forget the barrage of negative news and look instead at how the markets are just shaking them off. That's a strong bull run to me, higher in the face of negative news or the Fed on pause. Read the charts, follow the money – the signs of something fishy will manifest themselves well ahead. For now, the overall path of least resistance in the S&P 500 remains higher.
Disclaimer: All essays, research and information found above represent analyses and opinions of Monica Kingsley and Sunshine Profits' associates only. As such, it may prove wrong and be subject to change without notice. Opinions and analyses were based on data available to authors of respective essays at the time of writing. Although the information provided above is based on careful research and sources that are believed to be accurate, Monica Kingsley and her associates do not guarantee the accuracy or thoroughness of the data or information reported. The opinions published above are neither an offer nor a recommendation to purchase or sell any securities. Ms. Kingsley is not a Registered Securities Advisor. By reading Monica Kingsley’s reports you fully agree that she will not be held responsible or liable for any decisions you make regarding any information provided in these reports. Investing, trading and speculation in any financial markets may involve high risk of loss. Monica Kingsley, Sunshine Profits' employees and affiliates as well as members of their families may have a short or long position in any securities, including those mentioned in any of the reports or essays, and may make additional purchases and/or sales of those securities without notice.