First, avoid any ETFs below a $100 million market cap. Anything smaller puts you at risk of inadequate liquidity, too large a bid/ask spread and tracking error. Even $100 million can be too low. The bigger the market cap the less trading risk. Same rules apply for finding the best ETFs.
There are plenty of free services that allow you to screen out the smaller ETFs and minimize your trading risk.
The focus of this article, however, is on the underlying investment potential of ETFs. This potential is much more difficult to assess because it requires researching the investment potential of the ETFs holdings.
Contrary to the numerous screens on market cap and other technical measures, there are very few services (free or not) that evaluate the quality of the holdings of an ETF.
Research on holdings is necessary due diligence because an ETF’s performance is only as good as its holdings’ performance. No matter how cheap, if it holds bad stocks, the ETF’s performance will be bad.
PERFORMANCE OF ETF’s HOLDINGs = PERFORMANCE OF ETF
You cannot rely on the ETF label/name to accurately reflect the ETF’s holdings. ETFs with the same label often have radically different holdings. See Barron’s “The Danger Within”.
My ratings on ETFs are based primarily on my stock ratings of their holdings with over $100 million in assets.
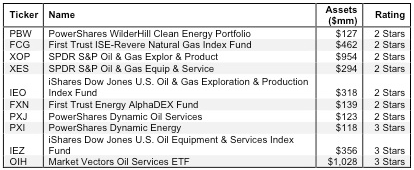
Figure 1 shows my ranking of the worst ten Energy Sector ETFs.
Not a single Energy Sector ETF gets an Attractive or better rating. PowerShares WilderHill Clean Energy Portfolio (PBW) is my worst-rated Energy ETF (with assets over $100 million). It allocates 45% of its portfolio to stocks that get a Dangerous or worse rating. Only 5% of its holdings get an Attractive or better rating.
Figure 1: Worst 10 Energy Sector ETFs

Sources: New Constructs, LLC and company filings
My ETF rating also takes into account the total annual costs, which represents the all-in cost of being in the ETF. This analysis is simpler for ETFs than funds because they do not charge front- or back-end loads and transaction costs are incurred directly. There is only the expense ratio, which is normally quite low. However, my ratings penalize those ETFs with abnormally high expense ratios or any other hidden costs.
Honestly, when the ETFs are invested so heavily in bad stocks, the expense ratio is the least of your problems.
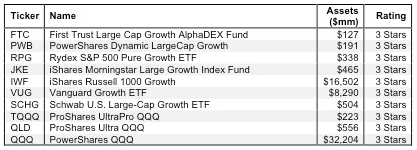
Figure 2 shows my ranking of the worst ten large-cap growth ETFs with a market cap over $100 million based on the quality of their holdings.
Figure 2: Worst 10 Large Cap Growth ETFs 
Sources: New Constructs, LLC and company filings
Note that none of the Large Cap Growth ETFs earn my Dangerous or Very Dangerous Rating. All of them get my Neutral (3 Star) rating. Nevertheless, investors should not settle. There are four Large Cap Growth ETFs that get my 4-Star or Attractive Rating.
First Trust Large Cap Growth AlphaDEX Fund (FTC) is my worst-rated Large Cap Growth ETF with more than $100 million in assets. It earns that rating by allocating nearly 20% of its portfolio to Dangerous-or-worse rated stocks. Another 40% of its portfolio goes to Neutral stocks. In other words, this ETF does not offer a high-quality portfolio of stocks. On the other hand, my top-rated Large Cap Value ETF, Vanguard S&P 500 Growth ETF (VOOG), allocates over 62% to stocks that get my Attractive or Very Attractive rating.
My favorite stock that shows up in the top Large Cap Growth ETFs is Apple (APPL). This stock gets my Very Attractive rating. AAPL has a return on invested capital (ROIC) of 334%, which places it in the top quintile of all companies. Investors do not fully recognize the bargain price at which APPL is selling given its extraordinarily high ROIC and growth.
My favorite Energy Sector stock is Exxon Mobil (XOM). In previous posts, I've explained how XOM has created enormous value for shareholders over the last quarter century. Buying Exxon Mobil (XOM) now is one of the easiest calls in the market these days. With superior cash flows, a cheap valuation and one of the strongest competitive positions in the business world, it is hard to make a straight-faced argument against owning this stock anywhere below $100. My model shows the stock is worth $140 if one assumes profits never grow from 2011 levels, i.e. the “no-growth” value of the stock.
The takeaway is that investors should buy ETFs that hold high-quality stocks. No reason to pay fees, even the lower ETF fees, to own bad stocks.
Disclosure: I own AAPL and XOM. I receive no compensation to write about any specific stock, sector or theme.
- English (UK)
- English (India)
- English (Canada)
- English (Australia)
- English (South Africa)
- English (Philippines)
- English (Nigeria)
- Deutsch
- Español (España)
- Español (México)
- Français
- Italiano
- Nederlands
- Português (Portugal)
- Polski
- Português (Brasil)
- Русский
- Türkçe
- العربية
- Ελληνικά
- Svenska
- Suomi
- עברית
- 日本語
- 한국어
- 简体中文
- 繁體中文
- Bahasa Indonesia
- Bahasa Melayu
- ไทย
- Tiếng Việt
- हिंदी
Some Thoughts On Avoiding The Worst ETFs
Published 10/16/2012, 07:24 AM
Updated 07/09/2023, 06:31 AM
Some Thoughts On Avoiding The Worst ETFs
3rd party Ad. Not an offer or recommendation by Investing.com. See disclosure here or
remove ads
.
Latest comments
Install Our App
Risk Disclosure: Trading in financial instruments and/or cryptocurrencies involves high risks including the risk of losing some, or all, of your investment amount, and may not be suitable for all investors. Prices of cryptocurrencies are extremely volatile and may be affected by external factors such as financial, regulatory or political events. Trading on margin increases the financial risks.
Before deciding to trade in financial instrument or cryptocurrencies you should be fully informed of the risks and costs associated with trading the financial markets, carefully consider your investment objectives, level of experience, and risk appetite, and seek professional advice where needed.
Fusion Media would like to remind you that the data contained in this website is not necessarily real-time nor accurate. The data and prices on the website are not necessarily provided by any market or exchange, but may be provided by market makers, and so prices may not be accurate and may differ from the actual price at any given market, meaning prices are indicative and not appropriate for trading purposes. Fusion Media and any provider of the data contained in this website will not accept liability for any loss or damage as a result of your trading, or your reliance on the information contained within this website.
It is prohibited to use, store, reproduce, display, modify, transmit or distribute the data contained in this website without the explicit prior written permission of Fusion Media and/or the data provider. All intellectual property rights are reserved by the providers and/or the exchange providing the data contained in this website.
Fusion Media may be compensated by the advertisers that appear on the website, based on your interaction with the advertisements or advertisers.
© 2007-2024 - Fusion Media Limited. All Rights Reserved.
