
The US dollar rebounded strongly against most of the other major currencies yesterday and today in Asia, with equities retreating sharply after the US CPIs accelerated by more than expected, increasing bets over a double hike at the March Fed meeting, and many more by the end of the year.
US CPIs Increase the Chance of a Double Fed Hike in March
The US dollar traded higher against all but one of the other major currencies on Thursday and during the Asian session Friday. It gained the most against AUD, NZD, and CAD, in that order, while it failed to record any gains, and instead was found unchanged, against GBP.

The strengthening of the US dollar and the weakening of the risk-linked Aussie, Kiwi, and Loonie, suggest a deteriorating market sentiment yesterday and today in Asia. Indeed, although most major EU indices traded slightly in the green, Wall Street tumbled after that, with the negative appetite rolling into the Asian session today.

Of course, the catalyst behind the switch in investors’ morale was the release of the US CPIs for January. The headline rate jumped to +7.5% YoY from +7.0%, exceeding the forecast of +7.3%, while the core one rose to +6.0% YoY from +5.5%, instead of rising to +5.9% as its forecast suggested.
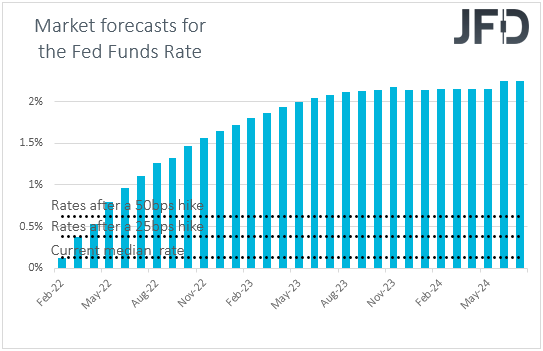
All this added credence to the view of faster tightening by the Fed, with some participants placing bets that the Committee could proceed with a 50 bps liftoff at its upcoming meeting next month. By the end of the year, the total number of quarter-point hikes has risen as well, from 5 to nearly 7.
Although we said that a potential setback in risk appetite might not signal a trend reversal, the reaction after the upside surprise suggests that we may see some more declines in risk assets for now. At the same time, the US dollar could keep recovering.
What adds to that view may be some technical breaks in some key equity indices and currency pairs. For example, both the Dow Jones Industrial Average and AUD/USD, the technical outlook of which we examine below in more detail, dipped below their respective upside support lines.
DJIA – Technical View
The Dow Jones Industrial Average cash index tumbled yesterday following the release of the US CPIs, breaking below the upside support line drawn from the low of Jan. 24. This has dismissed the bullish case for now and may have increased the chances for more declines, but to get more confident on that front, we prefer to wait for a break below 34785.
Such a move will confirm a forthcoming lower low on the 4-hour chart and may initially pave the way towards the low of Jan. 31, at 34425. If that barrier cannot halt the decline, we could see the bears diving towards the low of Jan. 28, at 33745.
To start examining the bullish case again, we would like to see a clear break above the round figure of 36000, marked by the peak of Jan. 17. This will confirm a forthcoming higher high and may initially target the 36460/36540 zone, marked by the highs of Jan. 6 and 12.
If the bulls do not stop there, we could see them climbing towards the record of 36950, hit on Jan. 5.

AUD/USD – Technical View
AUD/USD fell sharply yesterday after it hit resistance at 0.7250. The rate tumbled down to the upside support line drawn from the low of Jan. 28, and then, it broke it. Similar to the Dow Jones, this cancels the upside scenario for now. However, to get confident on the downside, we would like to see an apparent dip below 0.7085.
This may encourage the bears to aim for the 0.7050 barrier, marked by the low of Feb. 4, the break of which could aim for the low of Feb. 1, at 0.7035. If the bears are unwilling to stop there, we could see them diving towards the round figure of 0.7000, where another break could aim for the low of Jan. 28, at 0.6967.
On the upside, we would like to see a clear rebound back above 0.7180 before turning bullish again. This could signal the rate’s return above the upside line and may see scope for advances towards yesterday’s peak, at 0.7250. A break higher could extend the gains towards the 0.7275 zone or the 0.7315 barrier, marked by the high of Jan. 20 and 13, respectively.

As for Today’s Events
During the early European morning, we already got the preliminary UK GDP for Q4, with the QoQ rate missing its estimate by a fraction. Both the industrial and manufacturing production rates for December slid, but not as much as their forecasts suggested.
The pound reacted very little at the time of the release, which, in our view, suggests that GBP traders have not touched their bets with regards to the BoE’s future course of action.