A week ago, I wrote an analysis March 2015 New Home Sales Are Having a Rough Ride. Four Month Decline in New Home Prices. Although it may seem that I am negative on the future for new residential construction and its economic impact - I am not.
A short except from the analysis
The headlines say new home sales significantly declined from last month. This whole data series is suspect because of the significant backward revisions, a roller coaster of good months and bad months, and obvious seasonality issues. HOWEVER, the rolling averages smooth out much of the garbage produced in this series - and there was an insignificant improvement in the rolling averages. There is a continuing decline in new home prices.
Econintersect analysis:
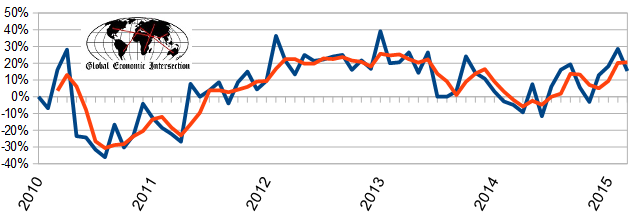
- unadjusted sales growth decelerated 13.2% month-over-month (after last month's upward revised acceleration of 10.4%).
- unadjusted year-over-year sales up 15.4% (Last month was revised up from 25.7% to 28.6%). Growth this month is above the range of growth seen last 12 months.
- three month unadjusted trend rate of growth accelerated 0.4% month-over-month - is up 20.5% year-over-year.
Unadjusted Year-over-Year Rate of Growth - Sales (blue line) and 3 month rolling average of Sales (red line)
In 1Q2006, residential construction comprised 6.6% of GDP - and is now recovering but at only 3.3% of GDP. Simply put, 3% of GDP has disappeared directly due to the slower growth rate of residential construction. Even though the March data sucked, this data series has been in a general uptrend since early 2014.
The graph below projects the trend rate of growth using contribution of residential construction to GDP - the old trend rate of growth starting in 2011 (upper growth boundary) and the new trend rate of growth starting in 2014 (lower growth boundary). The lower trend rate of growth for residential construction is now roughly paralleling GDP growth instead of recovering roughly to its pre Great Recession rate of growth trend line.
GDP (blue line) and Residential Construction Contribution to GDP (red line) Indexed to 1Q2000

Home Ownership
It is difficult to believe home sales will return to its former glory of the mid 2000s. This was a bubble created by flipping, lenient tax laws on second residences, low home interest rates, shadowy (illegal) manipulation of loan documents - all supported by the general belief home prices would never fall. Further homes generally sold rather swiftly in the good ole days. Now home ownership rates have fallen to nearly 30 year lows, and selling a home is a much slower process.
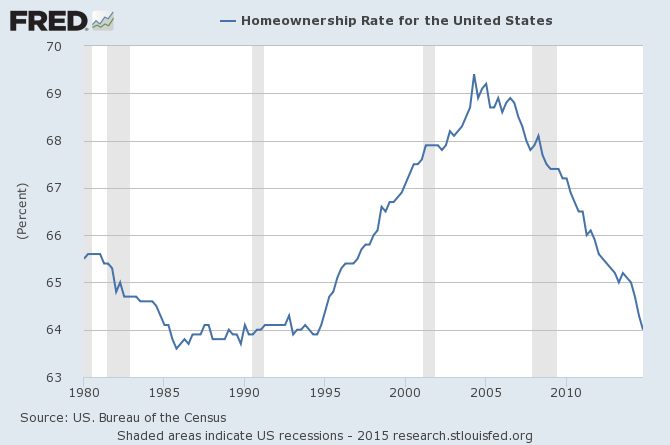
How much lower will home ownership fall? I continue to see negative dynamics winning in the short term:
- It continues to take too long to get a loan. The potential homeowner can get pre-approved in days - but the house they want to buy has to go through a battery of inspections and surveys which have been taking two or three months. Personally, I would reject any non-cash offer. The seller has no contractual relationship with lender - but is forced to live with out-of-contract demands and delays from the lender. [Note that Fannie and Freedie and FHA are more speedy than the private sector financing.]
- The rate of year-over-year home prices are growing approximately 5% per year. In the olden days (pre-Great Recession), you seldom had to worry about losing money if you purchased a home - no matter how short of time you occupied the home. Today, the economics says if you do not know how long you will stay somewhere - rent or lease a residence. Generally a minimum of two years or more owning a residence is necessary to break even.
- Because of the length of time it takes to sell a house (from listing to close) can take easily six months - sellers end up moving to their new location and renting. Once comfortable in their new rented home, there is little pressure or desire to purchase another home.
The bottom line is that home ownership is incompatible with employment mobility.
New Residential Construction
New residential construction services both homeowner and rental markets so is not constrained by the home ownership decline. Still, many renters are nesting in the remaining glut of existing detached single family homes - so there is a much lower demand for new constructed detached single family construction for the rental market. Overall new housing starts remain at historical recessionary levels. Just how ugly the current data is for new housing starts shown in the following graph becomes evident when one recognizes that the population of the U.S. has increased by nearly 80% in the years covered - and the number of households has more than doubled since 1958.
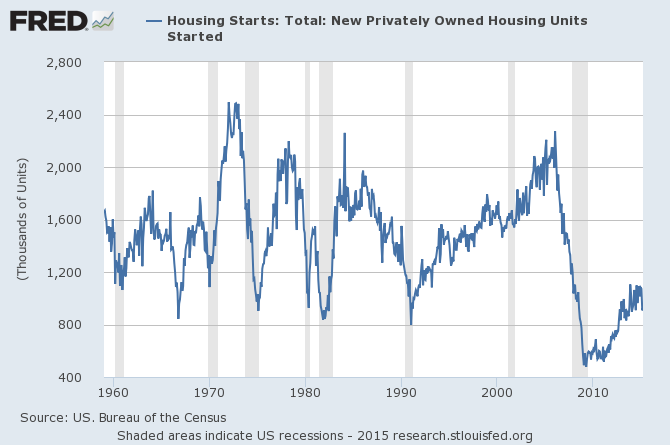
The new construction demand for multifamily new construction has nearly recovered to pre Great Recession levels. It is likely most of these homes are servicing the rental market - but the average price of a multifamily residence is lower than single family dwelling - so there is a much lower contribution to GDP.
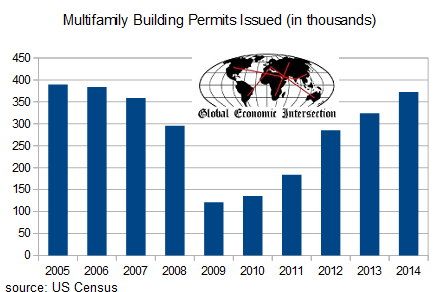
It is the single family detached home construction market which has collapsed. But as time passes and the housing glut created prior to the Great Recession is absorbed due to population growth and destruction of residential dwellings - the rate of increase in new home sales for both the rental and homeowner markets will continue to accelerate.
The question is not if but when new home sales will begin to accelerate.
Other Economic News this Week:
The Econintersect Economic Index for May 2015 is indicating growth will continue to be soft. The tracked sectors of the economy are relatively soft with most expanding but some contracting. The effects of the recently solved West Coast Port slowdown (a labor dispute which had been going on for months) and weather related issues are no longer evident in the raw data. Therefore, the economic slowdown forecast last month is cyclic and not resulting from transient causes.
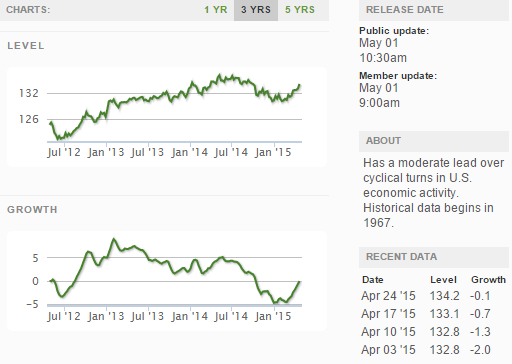
The ECRI WLI growth index remains slightly in negative territory which implies the economy will have little growth 6 months from today.
Current ECRI WLI Growth Index
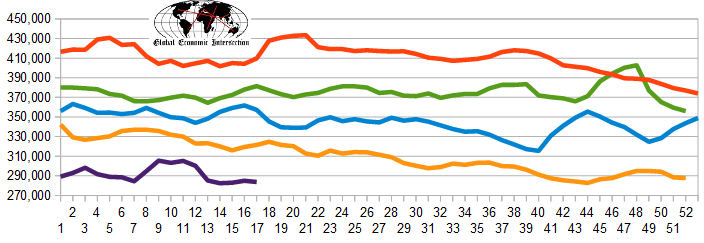
The market was expecting the weekly initial unemployment claims at 228,000 to 295,000 (consensus 288,000) vs the 262,000 reported. The more important (because of the volatility in the weekly reported claims and seasonality errors in adjusting the data) 4 week moving average moved from 285,000 (reported last week as 284,500) to 283,750. The rolling averages have been equal to or under 300,000 for most of the last 7 months.
Weekly Initial Unemployment Claims - 4 Week Average - Seasonally Adjusted - 2011 (red line), 2012 (green line), 2013 (blue line), 2014 (orange line), 2015 (violet line)
Bankruptcies this Week: none
Click here to view the scorecard table below with active hyperlinks
Weekly Economic Release Scorecard:


