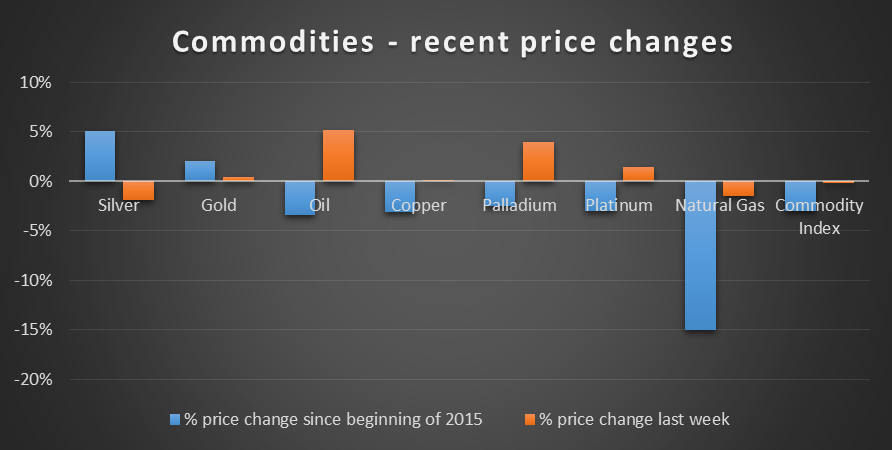
Silver has been in a long term downtrend in recent years, with the current price of $16.38 being 67% below the six year peak of $48.60 at the end of April, 2011. It has, however, enjoyed a minor resurgence this year, being the strongest performing of the major commodities:

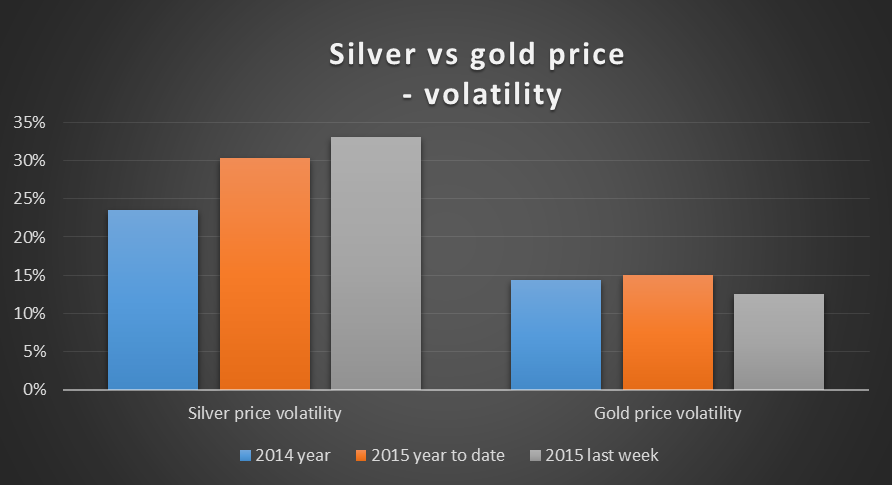
The volatility of silver's price has been approximately double that of the gold price and has been on the rise this year:

We have developed a fair value of the silver price based on a multiple regression analysis of its price on 22 driver variables including interest rates, stock indices, other commodities and exchange rates. The database is six years of daily prices.
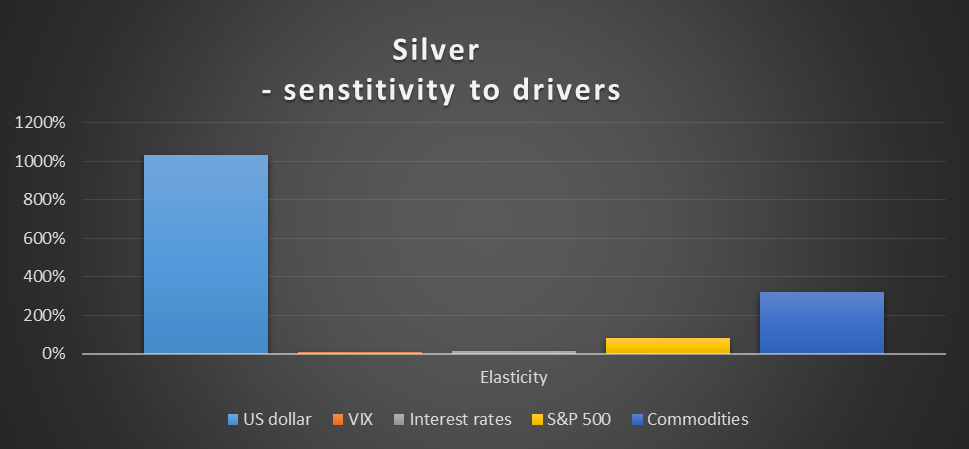
The elasticity of the silver fair value to groups of driver variables is shown in the graph below:

As can be seen, silver is highly positively correlated to the US dollar (in contrast to gold which is negatively correlated to USD).
We have also developed a prediction model based on the lead given by the change in the Baltic Dry Index (BDI) of raw material shipping freight rates. This index is widely seen as a leading indicator of world economic growth, with increases viewed as bullish and conversely.
Based on the BDI lead, it is possible to develop price predictions for a range of commodities, interest rates, stock indices and currencies. These can be combined with the fair value model elasticities shown above to give a predicted movement in the silver price over the next month. We also backtest the prediction models to assess their value in a trading environment (taking a long position when the predicted price change is positive and a short position when negative).
The predicted price changes for the next month, and the return/volatility ratio over the last six years from trading the predictions, are shown in the following table –

The 162.1% return/volatility from trading all the predictions combined compares with that applying to the S&P 500 over the same period, of 140.9%. We consider this to be reasonably robust given the period commences in mid-2009, around the start of the latest bull market in US stocks.
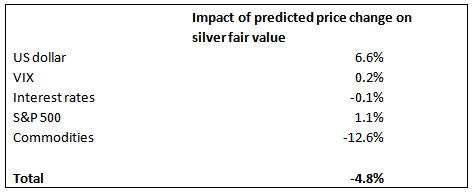
Our predicted movement in the silver price for the next month is shown in the table below. The contribution of each driver variable to the overall decrease is also shown.
As can be seen from the above two tables, our bearish view on commodities over the next month plays more heavily into the predicted silver price movement than our mildly positive view on the US dollar.

We also used the BDI model to directly forecast the silver price movement for the next month. A change of -3.8% resulted, confirming the signal given above. The backtest return/volatility ratio from trading this model was 88.8%.
Despite the volatility of the silver price, allocating a component of a US stock portfolio tracking the S&P 500 to silver traded using the BDI leading indicator as outlined in this article would have improved the return/volatility ratio of the portfolio. For a 5% allocation, the ratio would have improved from 140.9% to 150.8%.
