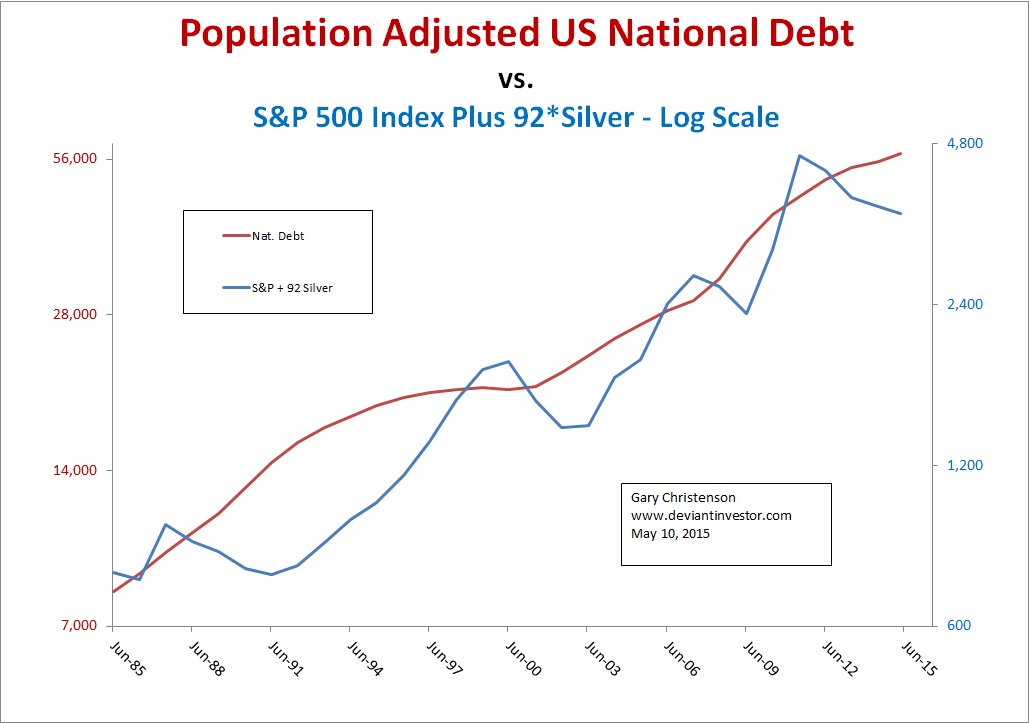
I recently published an article projecting possible prices for gold in the year 2020 based on the S&P 500 Index and the ever increasing population adjusted US national debt. I assumed three scenarios and three different gold projections. Time will tell regarding gold prices, but what is nearly certain is that national debt will exponentially increase. Further, over 30 years, the sum of the S&P and gold have increased similarly to the population adjusted national debt.
Similar analysis can be used to project silver prices. Based on the past 15 years, we should expect considerable and increasing volatility, as the next few years will probably see dramatically increasing debt, stock market corrections (the S&P is overvalued and probably peaking in 2015), deflationary forces and increasing debt defaults, desperate central banks “printing” even more currencies, a derivative scare or crash, central bank created consumer price inflation, another financial crisis, and the list goes on.
Given the difficulty of predicting prices in central bank managed markets, this analysis relies upon long-term trends. Consider the following:
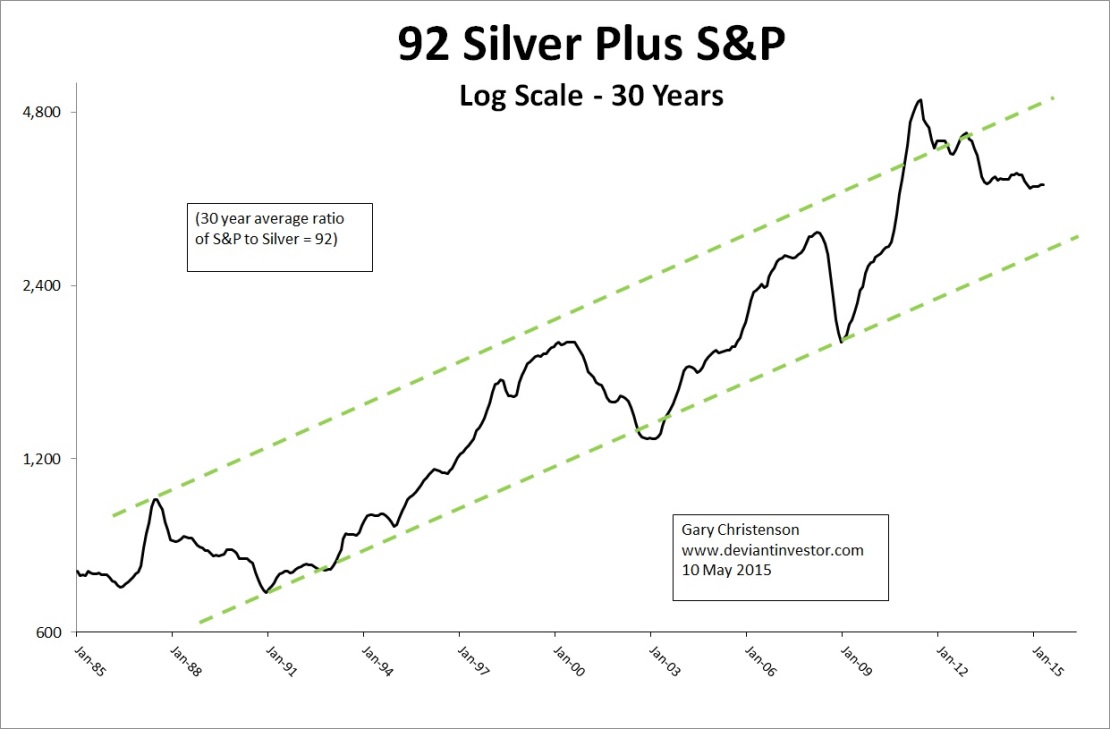
Population adjusted national debt and the sum of the S&P plus 92 times the price of silver show clear exponential increases over the past 30 years. Expect debt and the sum of the S&P and 92 times silver (SUM) to exponentially increase, perhaps even more rapidly.

Why use the sum of the S&P 500 Index and 92 times silver? Broadly speaking, the S&P represents paper assets while silver represents real assets, and the 30 year average ratio is 92. Both markets are heavily influenced by central bank manipulations and often one increases as the other decreases, but the sum increases along with debt.

BIG PICTURE SUMMARY:
Population adjusted national debt increases exponentially. The SUM (S&P + 92*silver) increases in an exponential channel at about 6% per year.
The numbers will be slightly different in Japan, the UK and Europe but the concept applies.
The S&P recently hit an all-time, central bank assisted high. Look out below!
Silver has fallen 2/3 from its near all-time high 4 years ago. The next major move is likely to be up.
The important question is: How will the silver market be affected by continued QE, gold price manipulations, central bank management of our casino-markets, Chinese gold purchases from western central banks, deflationary debt defaults, and consumer price inflation? One might also ask when confidence in fiat currencies and paper assets will deteriorate or plummet and when the world will return to the sanity of gold backed money and constrained government spending.
As in my gold article, I offer 3 scenarios based on various combinations of the above macro-economic conditions.
SPECULATION REGARDNG SILVER PRICES IN 2020:
MORE OF THE SAME SCENARIO: (I find this unlikely but the media likes it.)
US population adjusted national debt increases at 6.7%. (30 year average)
The S&P oscillates around 2,000 as the economy weakens.
No nuclear war, no financial meltdown, the usual politics, a “Demo-Publician” is elected in 2016, and no “black swans” swoop in to destabilize our financial world.
Silver is priced about $35 to $50, based on the exponentially increasing SUM.
CHICKENS COME HOME TO ROOST SCENARIO:
US population adjusted national debt increases more rapidly at about 7.5% per year until 2020. (Wars are expensive!)
The S&P weakens to average (guessing) 1,200 to 2,000.
The US dollar weakens compared to many other currencies and substantially against gold.
By 2020 many financial and paper assets are recognized as dangerous and gold and silver have been revalued far higher.
The SUM rises to the high end of its 30 year exponential range, and silver prices average about $80 to $120. Given silver’s volatility, history of manipulation, and small market, silver could spike higher toward $200.
HYPERINFLATIONARY SCENARIO for 2020:
Debt escalates out of control to unimaginable numbers. Governments find someone else to blame.
The S&P 500 Index goes parabolic.
Financial TV commentators are practically breathless as they discuss the huge increases in the S&P and ignore the rampant inflation, unemployed workers, human misery, and social distress.
Social and economic conditions are deadly and exceedingly difficult.
Income equality in the western world worsens and riots become more common.
Silver prices go parabolic and reach currently unthinkable numbers.
CONCLUSIONS REGARDING ALL SCENARIOS:
History and current actions justify the expectation that governments and central banks will increase debt, devalue fiat currencies, and thereby force silver and gold prices much higher.
Convert digital dollars, yen, pounds, and euros into silver and gold while you can. Current “on sale” prices will not last much longer.
