In my previous silver article, I highlighted a very bullish pattern/fractal on the 100-year silver chart. It was a very big picture view of silver, which is really difficult to perceive within our current reality. However, at some point in time it will catch up with our current reality. This will likely happen when the monetary system collapses.
Silver, even more than gold, is the opposite of what is considered a monetary asset (debt, like a federal reserve note) today. This is mainly because silver has been completely demonetized, whereas gold is still a part of the current system (think central bank gold reserves). When the illusion of money (value) is exposed for what it is (worthless paper or digits), then people will demand real money (value) like silver and gold.
We are on the cusp of that event, and that is when the ridiculous prices for silver and gold become a reality, until they are not traded in any of the fiat currencies at all. Now, I would like to look at a relatively shorter period, as compared to the 100-year period.
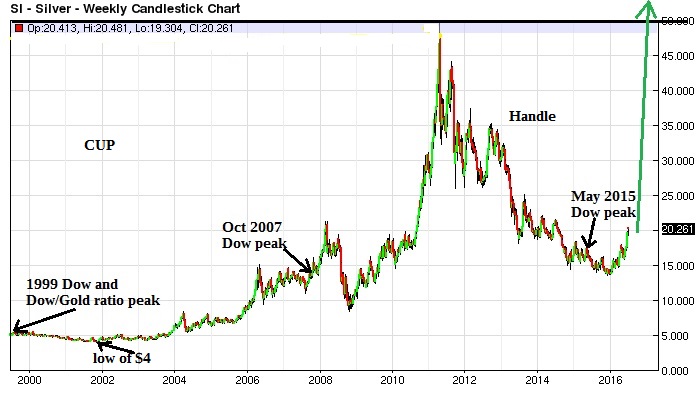
Below, is a silver chart that goes back to 1999. On the chart I have highlighted a period that is the end part of a longer pattern that goes back to 1980. You can see that although the period is much shorter than the 100-year period, it is still a relatively big picture view of silver.
However, this pattern, or fractal, is based on the same principle as the larger pattern that was dealt with in the previous article.

The pattern takes the form of a cup and handle pattern, with the cup starting in 1980 (out of view), and the handle starting at the top in 2011. We are getting closer to the explosive part of the pattern, with the best performance likely when silver prices go higher than the $50-level.
The expected target, based on the standard movement of such a pattern, can be calculated as follows:
The movement from the bottom of the cup in 2001 was from about $4 to about $50 in 2011 (note: there was a lower low in 1991, but I ignored it for comparison sake). This is a 12.5 (50/4) fold increase. Therefore, the target for this pattern would be a similar move from the $50 level. So, that would be a minimum target of $50 + ($50 x 12.5) = $675.
This is not some hopeful target. It is very realistic, since it has a historic precedent:

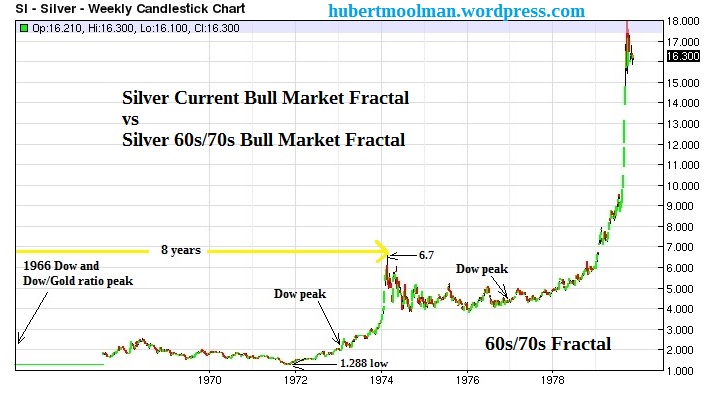
Above, is a silver chart from about 1966 to 1979. I have marked the chart in such a manner to show how it is similar to the current pattern (the first chart). For example, the high in 1974 (at $6.7) is similar to the 2011 high (at about $50).
If you were around in 1978 and decided that this was a cup and handle-type pattern, you could calculate a target as follows.
The movement from the bottom of the cup in 1971 was from about $1.288 to $6.7 in 1974. This is a 5.2 (6.7/1.288) fold increase. Therefore, the target for the pattern would be a similar move from the $50 level. So, that would be a minimum target of $6.7 + ($6.7 x 5.2) = $41.54.
In 1980, price did eventually go as high as the target and higher to $50. It would have been difficult to sell at $50, since it was not there for very long. So, the prudent target of $41.54 would have been a good exit point.
As you can see, the 70s pattern is very similar to the pattern that currently exists. Therefore, I do not think it is wishful thinking that silver will reach the target of $675 as a minimum. Now you have an opportunity to go back in time to 1978 without a time-machine, and make a similar but larger gain.
It is important to understand that a technical target alone is not enough to formulate an exit strategy. One needs to look at other measures as well.
