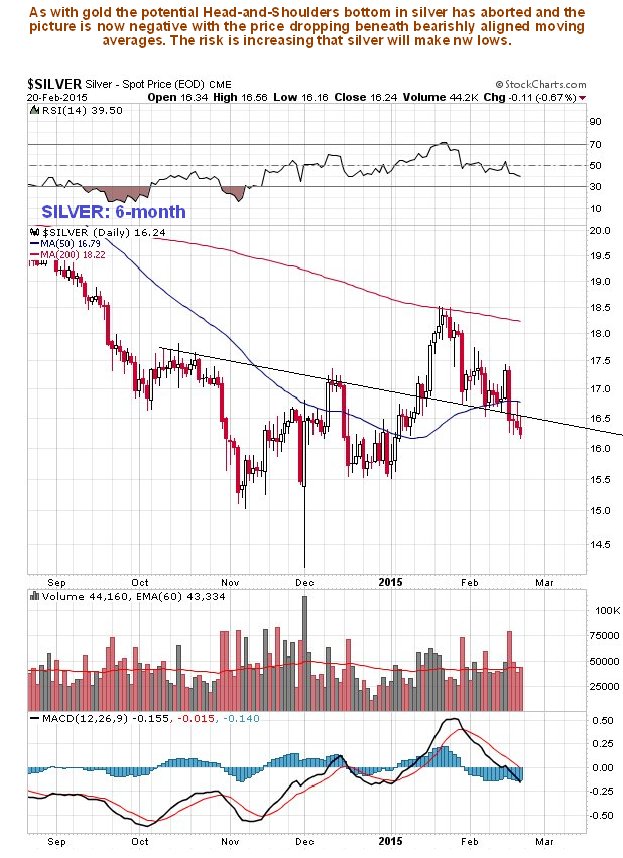
Following the recent explosion in Commercial short and Large Spec long positions in silver followed by a breakdown below the neckline of a potential Head-and-Shoulders bottom, the outlook for silver is bearish, with the metal stuck in a stubborn downtrend.
On its 6-month chart we can see how its advance early in the year hit a wall at its falling 200-day moving average, when Commercial short positions exploded, as we noted at the time on the site, and it has since reacted back, and with it failing to stabilize at the support at the neckline of the potential Head-and-Shoulders bottom, the medium-term outlook is bleak, which will not be changed by any bounces occasioned by the fact that it is now short-term oversold.
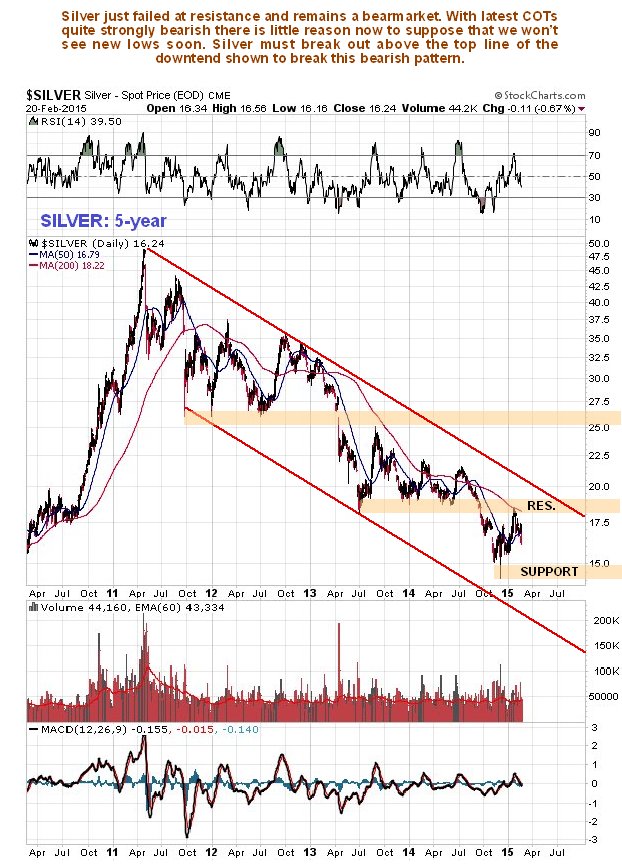
The 5-year chart pretty much tells us all that we need to know, as it makes very clear that silver is stuck in a stubborn downtrend, which at this point shows no sign of ending. Note how the price recently failed not just at its falling 200-day moving average, but also at a zone of resistance which was earlier an important support level. This following chart shows that new lows are likely to ensue. Investors should adopt a mechanical approach and simply assume that the downtrend remains in force until the price breaks out of it upside on good volume.
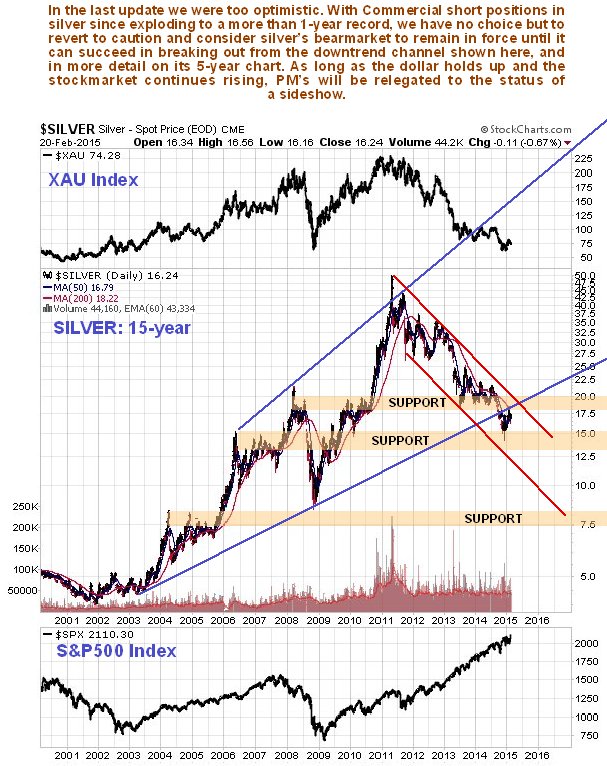
The long-term 15-year chart reveals that there is a zone of substantial support between $13 and $15, which may prevent further significant losses and may prevent new lows from occurring. However, this is a weak picture and will remain so until the price can break out of the downtrend shown.
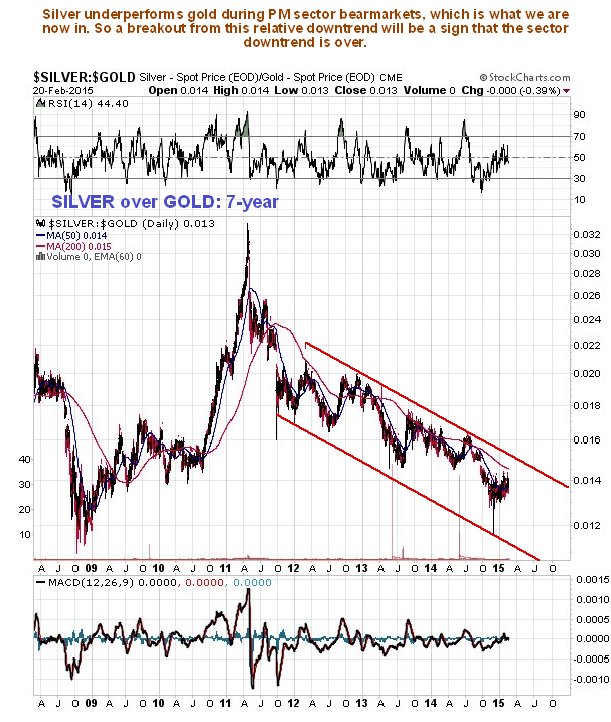
Because silver underperforms gold during sector bear markets, and the silver over gold ratio downtrend remains in force, as made plain by the 7-year chart for this ratio shown below, it is clear that the sector downtrend remains in force until we see a breakout from this ratio downtrend.
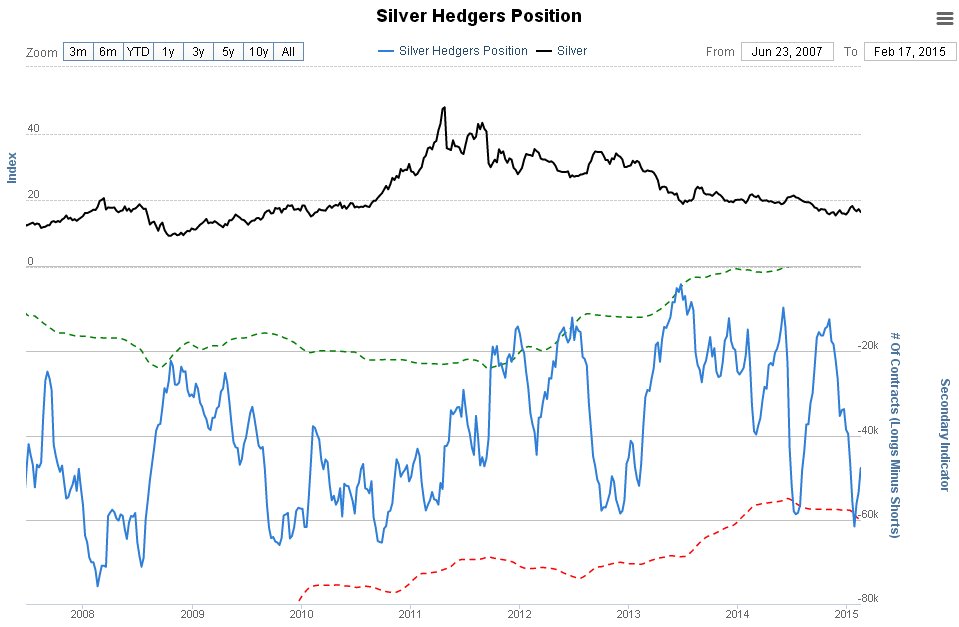
The silver hedgers chart, which is a form of COT chart, showed a bearish extreme at the peak a month ago, which has not eased much on the reaction, suggesting further weakness ahead.
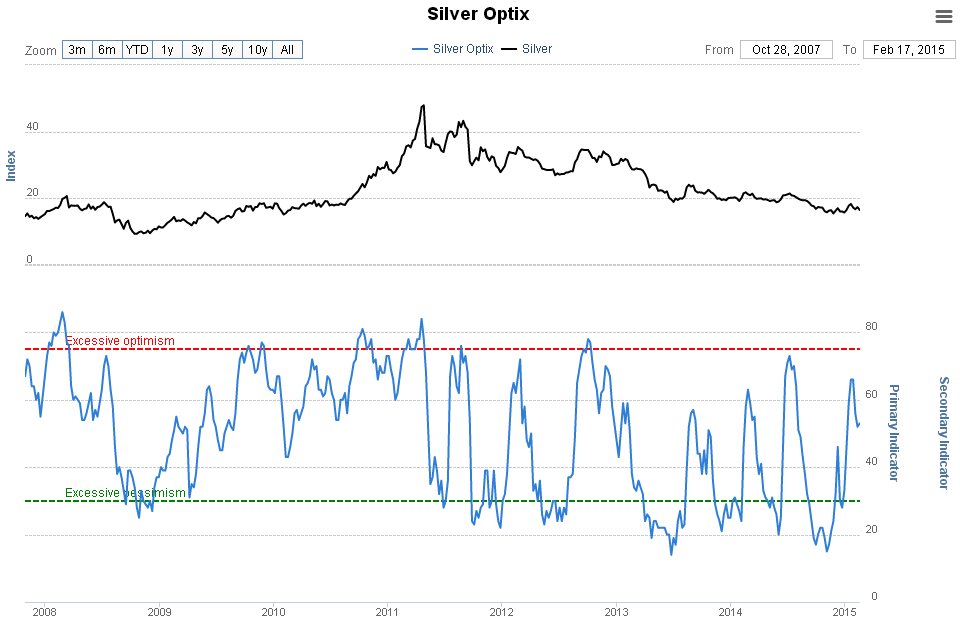
The silver optix or optimism chart is in middling ground and therefore doesn’t provide much guidance.
Finally, although the downtrend in silver looks depressing and like it may go on forever, we should remember that all downtrends end at some point. A big reason for the gloom afflicting the PM sector is that investors are happily chasing the broad stockmarket higher and higher.
They are following on the heels of Big Money which was awarded interest free grants by the Fed and other Central Banks, to go and play the carry trade and drive up global stockmarket and other favored speculative investments such as select property markets, like London. There are various indications that this could come to a dramatic end before much longer. When that happens we could see a sudden change in fortunes for the PM sector.
