Gold, silver and crude are battered and bruised as the week ends with a stronger U.S. dollar twisting the knife.
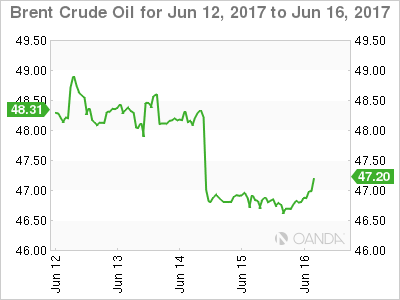
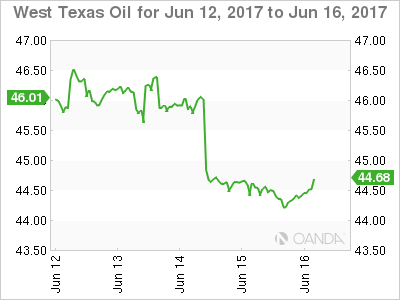
Crude oil limps into the last day of the week with both Brent and WTI down about 30 cents from the previous day’s lows, but still mired at the bottom of their recent ranges. Oil is unlikely to find solace into the weekend either with Friday's Baker Hughes Rig Count expected to deliver its now weekly increase of operational rigs which totalled 927 as of last week.
With both contracts now in sight of the May panic liquidation lows, OEC and Non-OPEC may find some cold comfort that at these levels many U.S. shale producers are maybe breaking into a cold sweat now as well. Much will depend on how much forward production shale has hedged via the selling of oil futures and we should get more visibility into this as we roll into the end of the month. But with U.S. shale production expected to hit 10 million bpd in 2018, this will only put off the day of reckoning for them as well.
Brent spot was trading at 46.80 this morning with initial support at 46.50 followed by the all-important May low at 46.30 just behind. A break of this level potentially opens up a test of November's low at 43.00. Daily resistance lies distant at 49.00.

WTI spot was trading at 44.40 with initial support around the overnight low of 44.15 followed by May’s panic sell-off low at 43.50. Beyond this level potentially sees a test of the November low at 42.00. Again, resistance is distant at 46.50.

PRECIOUS METALS
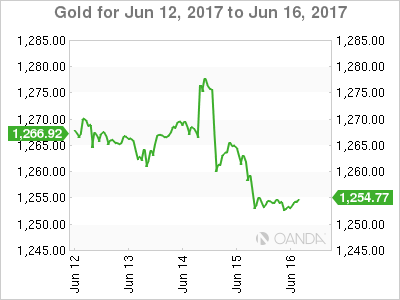
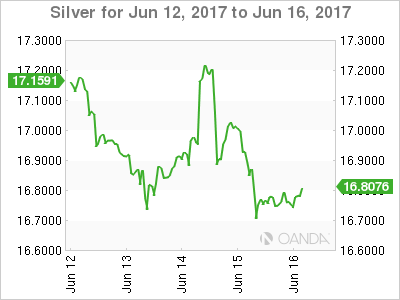
U.S. short end yields surged overnight sending the U.S. dollar higher across the board and nipping any nascent rally in gold and silver in the bud after a tough week for both. Wednesday’s potentially bullish technical indicators are now a distant memory as gold in particular eyes a critical support region.
In the absence of any geopolitical risk to help them, the price action in both gold and silver of late seems to imply that traders still have plenty of short-term long positioning on their books. Quite a lot of it most likely at less than salubrious levels above 1280.00 and 17.5000 respectively. It may leave both metals vulnerable to a further washout into the weekend if the U.S. dollar strength persists.
GOLD
Gold is trading at 1254.15 this morning with the critical support region of 1240/1245 lying just below. It contains a daily double bottom and the 100 and 200-day moving averages with a daily close below signalling a deeper technical correction. Resistance lies at 1266 initially and then 1280 with the 1296/1300 but a distant memory.

SILVER
Silver broke it’s 100 and 200-day moving averages a week ago, and both lie at 17.5000 and form significant resistance now. Silver trades at 16.7900 this morning with support nearby at 16.6400, the overnight low and then 16.4150.

