
Value investing is easily one of the most popular ways to find great stocks in any market environment. After all, who wouldn’t want to find stocks that are either flying under the radar and are compelling buys, or offer up tantalizing discounts when compared to fair value? 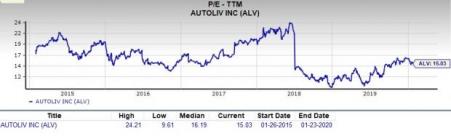
Autoliv, Inc. (ALV): Free Stock Analysis Report
Original post
Zacks Investment Research
One way to find these companies is by looking at several key metrics and financial ratios, many of which are crucial in the value stock selection process. Let’s put Autoliv, Inc. (NYSE:ALV) stock into this equation and find out if it is a good choice for value-oriented investors right now, or if investors subscribing to this methodology should look elsewhere for top picks:
PE Ratio
A key metric that value investors always look at is the Price to Earnings Ratio, or PE for short. This shows us how much investors are willing to pay for each dollar of earnings in a given stock, and is easily one of the most popular financial ratios in the world. The best use of the PE ratio is to compare the stock’s current PE ratio with: a) where this ratio has been in the past; b) how it compares to the average for the industry/sector; and c) how it compares to the market as a whole.
On this front, Autoliv has a trailing twelve months PE ratio of 15.03, as you can see in the chart below:
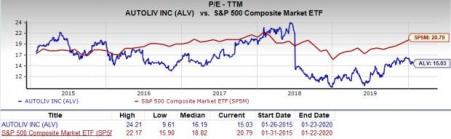
This level actually compares pretty favorably with the market at large, as the PE for the S&P 500 stands at about 20.79. If we focus on the long-term PE trend, Autoliv’s current PE level puts it slightly below its midpoint of 16.19 over the past five years.
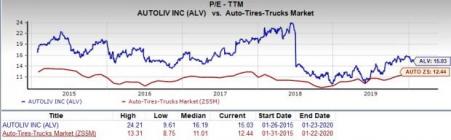
However, the stock’s PE also compares unfavorably with the Auto-Tires-Trucks Market’s trailing twelve months PE ratio, which stands at 12.44. Hence, this indicates that the stock is relatively overvalued right now, compared to its peers.
We should also point out that Autoliv has a forward PE ratio (price relative to this year’s earnings) of 12.08, which is lower than the current PE level. So, it is fair to say that a slightly more value-oriented path may be ahead for Autoliv stock in the near term too.
P/S Ratio
Another key metric to note is the Price/Sales ratio. This approach compares a given stock’s price to its total sales, where a lower reading is generally considered better. Some people like this metric more than other value-focused ones because it looks at sales, something that is far harder to manipulate with accounting tricks than earnings.
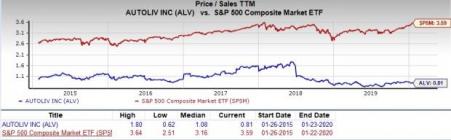
Right now, Autoliv has a P/S ratio of about 0.81. This is quite lower than the S&P 500 average, which comes in at 3.59x right now. Also, as we can see in the chart below, this is well below the highs for this stock in particular over the past few years.
We should also point out that Autoliv has a forward PE ratio (price relative to this year’s earnings) of 12.08, which is lower than the current PE level. So, it is fair to say that a slightly more value-oriented path may be ahead for Autoliv stock in the near term too.
P/S Ratio
Another key metric to note is the Price/Sales ratio. This approach compares a given stock’s price to its total sales, where a lower reading is generally considered better. Some people like this metric more than other value-focused ones because it looks at sales, something that is far harder to manipulate with accounting tricks than earnings.
Right now, Autoliv has a P/S ratio of about 0.81. This is quite lower than the S&P 500 average, which comes in at 3.59x right now. Also, as we can see in the chart below, this is well below the highs for this stock in particular over the past few years.
Broad Value Outlook
In aggregate, Autoliv currently has a Value Score of B, putting it into the top 40% of all stocks we cover from this look. This makes Autoliv a solid choice for value investors.
What About the Stock Overall?
Though Autoliv might be a good choice for value investors, there are plenty of other factors to consider before investing in this name. In particular, it is worth noting that the company has a Growth Score of B and a Momentum Score of F. This gives ALV a Zacks VGM score — or its overarching fundamental grade — of B. (You can read more about the Zacks Style Scores here >>).
Meanwhile, the company’s recent earnings estimates have been mixed at best. The current quarter has seen no estimates go higher in the past sixty days compared to one lower, while the full-year estimate has seen two up and two down in the same time period.
This has had a mixed impact on the consensus estimate as the current-quarter consensus estimate has inched down 0.6% in the past two months, while the full-year estimate has remained stable over the same time frame. You can see the consensus estimate trend and recent price action for the stock in the chart below:
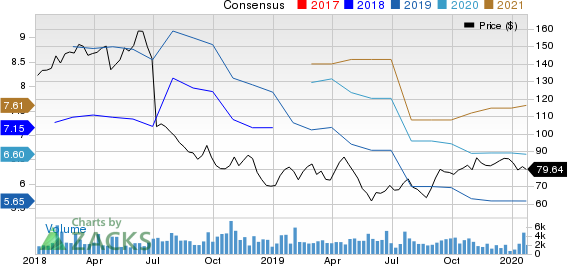
This somewhat mixed trend is why the stock has a Zacks Rank #3 (Hold) and it is the reason why we are looking for in-line performance from the company in the near term.
Bottom Line
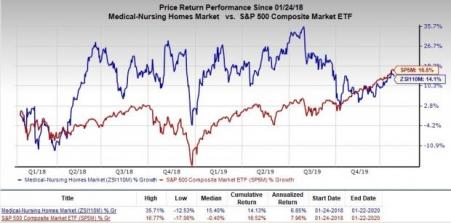
Autoliv is an inspired choice for value investors, as it is hard to beat its incredible lineup of statistics on this front. Besides a sluggish industry rank (Bottom 35% of 255 industries), with a Zacks Rank #3 it is hard to get too excited about the stock.
Also, over the past two years, the broader industry has clearly underperformed the broader market, as you can see below:
Hence value investors might want to wait for the Zacks Rank, industry ranks, performance and analyst sentiments to turn around in the name first and once that happens, this is likely to be a compelling pick.
Zacks Top 10 Stocks for 2020
In addition to the stocks discussed above, would you like to know about our 10 finest buy-and-hold tickers for the entirety of 2020?
Last year's 2019 Zacks Top 10 Stocks portfolio returned gains as high as +102.7%. Now a brand-new portfolio has been handpicked from over 4,000 companies covered by the Zacks Rank. Don’t miss your chance to get in on these long-term buys.
Autoliv, Inc. (ALV): Free Stock Analysis Report
Original post
Zacks Investment Research