
Shaw Communications Inc. (NYSE:SJR) reported impressive financial results for the third quarter of fiscal 2017 (ended May 31, 2017) wherein both the bottom line and top line surpassed the Zacks Consensus Estimate.
Net Income
Net income was $179.15 million, reflecting a decrease of 81.1% from $948.29 million in the third quarter of fiscal 2016. Adjusted earnings per share (EPS) of 44 cents outpaced the Zacks Consensus Estimate of 25 cents. The company’s bottom line grew 18.92%, on a year-over-year basis.
Revenue
Total revenue came in at $1766.2 million, reflecting an increase of 79.03% from $986.5 million in the year-ago quarter. Moreover, the top line beat the Zacks Consensus Estimate of $992.5 million
Operating Metrics
Third-quarter fiscal 2017 operating income before restructuring costs and amortization was $740.85 million, down 0.5% from $744.89 million in the fiscal third quarter of 2016. Operating margin came at 42.0%, down from 43.4% in the year ago quarter.
Cash Flow
In the third quarter of fiscal 2017, Shaw Communications generated $173.76 million cash from continued operations compared with $202.05 million from the prior-year quarter.
Free cash flow came in at $177.80 million versus $245.15 million in the year-ago quarter, reflecting an decrease of 27.5%. The decrease in free cash flow was largely due to high planned capital expenditures and low free cash flow from discontinued operations primarily related to former Media operations (sold on Apr 1, 2016). The decreases were partially offset by higher dividends from Corus.
Liquidity
At the end of third-quarter fiscal 2017, Shaw Communications had cash and total outstanding debt of $235.73 million and $7,677.9 compared with $545.54 million and $7,186.25 million, respectively, at the end of Aug 2016.
Subscriber Statistics (As of May 31, 2017)
At the Consumer segment, the video cable customer base totaled 1,663,710,reflecting a net addition of 12,921subscribers in the quarter under review. Video satellite customer count increased 6,531to 776,825. Meanwhile, with the addition of 20,892customers in the quarter, the company's Internet base now stands at 1,838,964. Digital phone lines grossed 930,066, reflecting a sequential reduction of 1,827 lines.
In the Business Network Service segment, the video cable customer base totaled 53,522, marking a net gain of 47 customers in the quarter. Video satellite customers decreased by 1,009 to 30,991. Further, the company lost 435 Internet customers, taking the tally to 172,709. Digital phone lines grossed 319,637 reflecting a sequential addition of 7,253 lines.
In the Wireless Segment, the postpaid customer base totaled 735,002 marking a net addition of 20,085 customers from the previous quarter. The prepaid section however lost 111 customers from the prior-year quarter, taking the total to 371,157 customers.
The period, however, ended with 6,892,583 customers, inclusive of 1,106,159 Wireless subscribers. Consumer and Business Network Services saw a combined 44,373 RGU (revenue generating unit) incline in the quarter, marking a significant improvement. Cable TV subscribers grew for the first time since 2010, with Consumer and Wireless divisions gaining 58,491 subscribers.
Consumer Segment
Quarterly revenues grossed $1252.71 million in the fiscal third quarter, down 0.5% year over year from $1259.44 million. Quarterly operating income before restructuring costs and amortization came in at $540.15 million, down 6.1% year-over-year. Operating margin was 43.1%, down from 45.7% in the third quarter of fiscal 2016.
Business Network Services Segment
Quarterly total revenue from the division was $184.54 million, up 7.0% year over year from $172.42 million. The segment’s quarterly operating income before restructuring costs and amortization was $94.29 million, up 9.4% year over year from $86.21 million. Operating margin came in at 51.1%, up from 50.0% from the third quarter of fiscal 2016.
Business Infrastructure Services Segment
Quarterly total revenue was $129.31 million, up 11.6% year over year from $115.84 million. Operating income before restructuring costs and amortization was $49.84 million, up 12.1% year over year from $44.45 million. Operating margin for the third quarter of fiscal 2017 was 38.5%, up from 38.4% in the comparable quarter a year ago.
Wireless Service Segment
Quarterly revenues from the newly acquired wireless segment was $207.44 million (up 16.7% year-over-year) in the third quarter of fiscal 2017 while operating income before restructuring costs and amortization was $56.57 million (up 44.8% year-over-year). Operating margin came in at 27.3%, up from 22.0% in the year-ago quarter.
Shaw Communications Inc. Price, Consensus and EPS Surprise
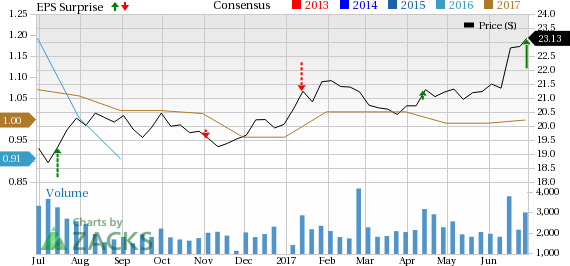
Shaw Communications Inc. Price, Consensus and EPS Surprise | Shaw Communications Inc. Quote
Financial Outlook
Shaw Communications is refining its full year fiscal 2017 financial guidance. Operating income before restructuring costs and amortization is expected to range between $2.135 and $2.160 billion and free cash flow is expected around $400 million. Consolidated capital investment targets have been raised to nearly $1.35 billion from $1.3 billion (previous quarter guidance).
Shaw Communications operates in a highly competitive wireless market with incumbents like Rogers Communications Inc. (NYSE:RCI) , TELUS Corp. (NYSE:TU) and BCE Inc. (TO:BCE) . The company’s operation in a highly competitive wireless market led to losses in its video, Internet and landline phone business. The company currently carries a Zacks Rank #3 (Hold). You can see the complete list of today’s Zacks #1 Rank (Strong Buy) stocks here.
Notably, shares of Shaw Communications outperformed the Zacks categorized Cable TV industry’s growth over the past three months. The stock registered growth of 11.52% beating the industry’s growth of 3.96%.

Today's Stocks from Zacks' Hottest Strategies
It's hard to believe, even for us at Zacks. But while the market gained +18.8% from 2016 - Q1 2017, our top stock-picking screens have returned +157.0%, +128.0%, +97.8%, +94.7%, and +90.2% respectively.
And this outperformance has not just been a recent phenomenon. Over the years it has been remarkably consistent. From 2000 - Q1 2017, the composite yearly average gain for these strategies has beaten the market more than 11X over. Maybe even more remarkable is the fact that we're willing to share their latest stocks with you without cost or obligation. See Them Free>>
TELUS Corporation (TU): Free Stock Analysis Report
BCE, Inc. (BCE): Free Stock Analysis Report
Shaw Communications Inc. (SJR): Free Stock Analysis Report
Rogers Communication, Inc. (RCI): Free Stock Analysis Report
Original post