
ServiceMaster Global Holdings, Inc. (NYSE:SERV) reported mixed fourth-quarter 2019 results wherein earnings beat the Zacks Consensus Estimate but revenues lagged the same.
Adjusted EPS of 22 cents came above the consensus mark as well as the year-ago figure by 16%. Lower year-over-year tax expense drove the bottom line.
Revenues of $507 million marginally missed the consensus mark but increased 11% year over year. The top line benefited from acquisitions, progress on commercial national account and health care cleaning and disinfection.
We observe that shares of the company have decreased 22.5% over the past year compared with the 11.8% decline of the industry it belongs to.

Other Quarterly Numbers
Terminix revenues of $423 million increased 7% year over year. ServiceMaster Brands revenues increased 8% year over year to $66 million.
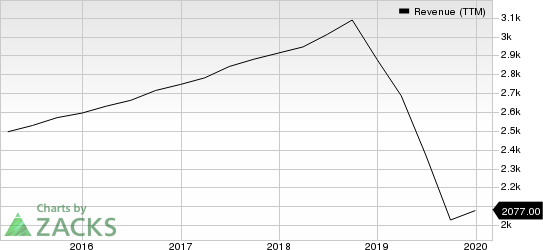
ServiceMaster Global Holdings, Inc. Revenue (TTM)
Adjusted EBITDA of $80 million was roughly flat year over year. Adjusted EBITDA margin of 15.7% declined 190 basis points year over year.
The company exited the quarter with cash and cash equivalent balance of $280 million compared with $140 million at the end of prior quarter. Long-term debt was $1.7 billion compared with $1.4 billion at the end of prior quarter.
The company generated $32 million of cash from operating activities. Free cash flow came in at $25 million. It repurchased $14 million of shares in the quarter.
2020 Outlook
ServiceMaster expects 2020 revenues in the range of $1.98-$2 billion. Organic revenue growth at Terminix is expected to lie between 3% and 4%. Adjusted EBITDA is expected between $320 million and $335 million.
Zacks Rank & Stocks to Consider
ServiceMastercurrently carries a Zacks Rank #3 (Hold).
Some better-ranked stocks in the broader Zacks Business Services sector are S&P Global (NYSE:SPGI) , NV5 Global (NASDAQ:NVEE) and CoreLogic (NYSE:CLGX) , each carrying a Zacks Rank #2 (Buy). You can see the complete list of today’s Zacks #1 Rank (Strong Buy) stocks here.
Long-term earnings (three to five years) growth rate for S&P Global, NV5 Global and CoreLogic is estimated at 10%, 20% and 11%, respectively.
Looking for Stocks with Skyrocketing Upside?
Zacks has just released a Special Report on the booming investment opportunities of legal marijuana.
Ignited by new referendums and legislation, this industry is expected to blast from an already robust $6.7 billion to $20.2 billion in 2021. Early investors stand to make a killing, but you have to be ready to act and know just where to look.
See the pot trades we're targeting>>
CoreLogic, Inc. (CLGX): Free Stock Analysis Report
ServiceMaster Global Holdings, Inc. (SERV): Free Stock Analysis Report
NV5 Global, Inc. (NVEE): Free Stock Analysis Report
S&P Global Inc. (SPGI): Free Stock Analysis Report
Original post
Zacks Investment Research