
Service Now (NYSE:NOW) reported fourth-quarter 2019 adjusted earnings of 96 cents per share, which beat the Zacks Consensus Estimate by 9.1% and increased 24.7% year over year.
Revenues of $951.8 million beat the consensus mark by 1% and increased 33.1% year over year.
Moreover, non-GAAP revenues (excluding impact of foreign exchange) of $960.4 million surged 34% from the year-ago quarter.
ServiceNow, Inc. Price, Consensus and EPS Surprise
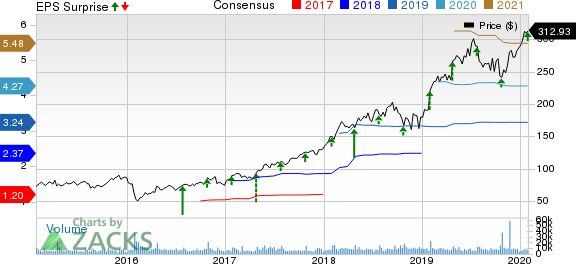
ServiceNow, Inc. price-consensus-eps-surprise-chart | ServiceNow, Inc. Quote
Quarter Details
Non-GAAP Subscription revenues (adjusted for constant currency) advanced 36% from the year-ago quarter to $907 million.
Non-GAAP Professional services and other revenues improved 8% (adjusted for constant currency) from the year-ago quarter to $53.3 million.
Total billings improved 35% on a year-over-year basis (adjusted for constant currency and constant billings duration) to $1.365 billion.
Non-GAAP adjusted subscription billings of $1.303 billion surged 37% year over year. Professional services and other billings increased 1% to $61.4 million.
ServiceNow maintained consistent renewal rate of 97% during the reported quarter.
Additionally, the company completed 76 transactions that generated net new annualized contract value (ACV) exceeding $1 million. Further, the company’s total number of customers contributing more than $1 million to business reached 892 in the fourth quarter. The figure surged 32% on a year-over-year basis.
The ongoing digital transformation of organizations, including big private and public companies, and different levels of government agencies, drove the company’s growth during the quarter. ServiceNow’s expanding global footprint was also a positive.
Operating Details
In the fourth quarter, non-GAAP gross margin was 82%, up 200 basis points (bps) on a year-over-year basis.
The company’s non-GAAP operating margin was 22%, expanding 100 bps on a year-over-year basis.
Balance Sheet & Cash Flow
As of Dec 31, 2019, ServiceNow had cash and cash equivalents and short-term investments of $1.691 billion compared with $1.471 billion as of Sep 30, 2019.
During the reported quarter, cash from operations came in at $421.2 million compared with the prior-quarter figure of $210 million. The company also generated free cash flow of $342.2 million compared with $121 million reported in the prior quarter.
Further, non-GAAP free cash flow margin was 36%, up 200 basis points on a year-over-year basis.
First-Quarter Guidance
For first-quarter 2020, non-GAAP adjusted subscription revenues are anticipated between $978 million and $983 million, indicating growth of 32%-33% from the year-ago quarter.
Non-GAAP adjusted subscription billings are projected within the range of $1.042-$1.047 billion, suggesting an improvement of 29% from the year-ago reported figure.
Further, non-GAAP operating margin is anticipated to be 22%.
2020 Guidance
For full-year 2020, non-GAAP adjusted subscription revenues are anticipated between $4.21 billion and $4.23 billion, indicating growth of 29%-30% from the year-ago quarter.
Non-GAAP adjusted subscription billings are projected within the range of $4.807-$4.827 billion, suggesting an improvement of 27% from the year-ago reported figure.
Further, non-GAAP operating margin is anticipated to be 22%.
Zacks Rank & Other Stocks to Consider
Currently, ServiceNow carries a Zacks Rank #2 (Buy).
Some other top-ranked stocks in the broader technology sector include Advanced Energy Industries (NASDAQ:AEIS) , Perion Network Ltd (NASDAQ:PERI) and CEVA, Inc. (NASDAQ:CEVA) each sporting a Zacks Rank #1 (Strong Buy). You can see the complete list of today’s Zacks #1 Rank stocks here.
Advanced Energy Industries, and CEVA are set to report quarterly results on Feb 18, while Perion is set to report on Feb 12.
Breakout Biotech Stocks with Triple-Digit Profit Potential
The biotech sector is projected to surge beyond $775 billion by 2024 as scientists develop treatments for thousands of diseases. They’re also finding ways to edit the human genome to literally erase our vulnerability to these diseases.
Zacks has just released Century of Biology: 7 Biotech Stocks to Buy Right Now to help investors profit from 7 stocks poised for outperformance. Our recent biotech recommendations have produced gains of +50%, +83% and +164% in as little as 2 months. The stocks in this report could perform even better.
See these 7 breakthrough stocks now>>
Perion Network Ltd (PERI): Free Stock Analysis Report
ServiceNow, Inc. (NOW): Free Stock Analysis Report
CEVA, Inc. (CEVA): Free Stock Analysis Report
Advanced Energy Industries, Inc. (AEIS): Free Stock Analysis Report
Original post
Zacks Investment Research