
SemGroup Corporation (NYSE:SEMG) reported adjusted loss of 18 cents per share in first-quarter 2019, much wider than the Zacks Consensus Estimate of a loss of a penny. The underperformance was attributed to weaker-than-expected contribution from U.S. Gas and Canada units. Precisely, profits from U.S. Gas and Canada units came in at $12.2 million and 22.7 million, lagging the Zacks Consensus Estimate of $15.8 million and $25.5 million, respectively.
However, the reported loss was narrower than the year-ago loss of 35 cents a share, primarily on the back of higher y/y contribution from its biggest segment, U.S. Liquids.
Total revenues recorded in the quarter came in at $567.2 million, surpassing the Zacks Consensus Estimate of $553 million. However, the top line declined from the prior-year sales of $661.6 million.
SemGroup Corporation Price, Consensus and EPS Surprise
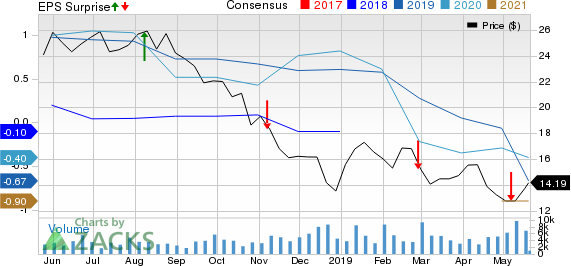
SemGroup Corporation price-consensus-eps-surprise-chart | SemGroup Corporation Quote
Segmental Information
U.S. Liquids: This segment — which includes operations of SemGroup U.S. Crude Transportation, Crude Facilities, and Storage Operation, Crude Supply & Logistics and HFOTCO — recorded a profit of $89.5 million, reflecting a rise of 31.4% from the year-ago quarter. White Cliffs pipeline volumes of 147 thousand barrels per day (Mbbl/d) were notably higher than the year-ago figure of 107Mbbl/d. Additionally, margin gains and higher utilization from Cushing and Houston storage terminals drove the segment’s results.
U.S. Gas: Profit generated from this segment (the erstwhile SemGas unit) amounted to $12.2 million, lower than $14.3 million income recorded a year ago amid reduced average processing volumes and drilling activities.
Canada: This unit includes the results of SemGroup’s legacy SemCAMS segment plus Meritage assets.
The segment’s profit in the quarter under review totaled $22.7 million compared with $22.1 million incurred in the corresponding quarter of the last year. The improvement can be attributed to higher average gas processing volumes on the back of incremental contribution from new plants namely, Patterson Creek and Wapiti.
Balance Sheet & Guidance
As of Mar 31, the company had a long-term debt of around $2.5 billion. Its debt-to-capitalization ratio was 54%.
SemGroup reaffirmed its guidance for 2019. The firm expects full-year 2019 net capital outlay of $307 million that includes $45 million associated with maintenance projects. Further, the company projects adjusted EBITDA for the year in the $420-$465 million range.
Zacks Rank and Key Picks
SemGroup currently carries a Zacks Rank #5 (Strong Sell).
Meanwhile, investors interested in the same industry can consider better-ranked players like EQT Midstream Partners, LP (NYSE:EQM) , Holly Energy Partners, L.P. (NYSE:HEP) and Plains Group Holdings, L.P. (NYSE:PAGP) , each holding a Zacks Rank #2 (Buy). You can see the complete list of today’s Zacks #1 Rank (Strong Buy) stocks here.
Will you retire a millionaire?
One out of every six people retires a multimillionaire. Get smart tips you can do today to become one of them in a new Special Report, “7 Things You Can Do Now to Retire a Multimillionaire.”
Plains Group Holdings, L.P. (PAGP): Free Stock Analysis Report
EQT Midstream Partners, LP (EQM): Free Stock Analysis Report
SemGroup Corporation (SEMG): Free Stock Analysis Report
Holly Energy Partners, L.P. (HEP): Free Stock Analysis Report
Original post
Zacks Investment Research