Would you take a drug that caused side effects such as headaches, muscle pain, dizziness, vomiting, uncontrollable flatulence, intestinal bleeding, blindness, or gynecomastia (man boobs)?
I bet you’re shouting, “No!”
But if the benefits of the drug far outweighed the risks – and the risks themselves weren’t inherently great – you might change your mind.
Similarly, when deciding whether to make an investment, we need to assess the risks and potential reward.
Of course, this isn’t a perfect analogy. Unlike the probability of adverse effects from drugs, investment risks tend to vary significantly over time. In particular, many healthcare stocks have dramatically different risk profiles than they did in the past.
Yet, few investors have seemed to notice.
That’s partly because the healthcare sector does have a lot to offer. Conservative investors have been drawn to the defensive qualities of the drug and medical device producers, while more aggressive traders and investors have gravitated towards high-growth biotechnology stocks.
Accordingly, the healthcare sector has been a stellar performer over the past five years. The Health Care Select Sector SPDR (N:XLV) has produced a total return of 142.3% compared with a 90.3% return for the SPDR S&P 500 (N:SPY).
But that sort of outperformance has significantly altered the risk/return prospects for many healthcare stocks.
Eli Lilly and Company (N:LLY), a major pharmaceutical company, is perhaps the best example. Not many people found Eli Lilly attractive in late 2010 because its stock wasn’t going up. Ironically, the stock has been on a tear ever since, gaining 159% on a total return basis. Plain and simple, LLY is in a sector that caught fire, and it became a momentum stock.
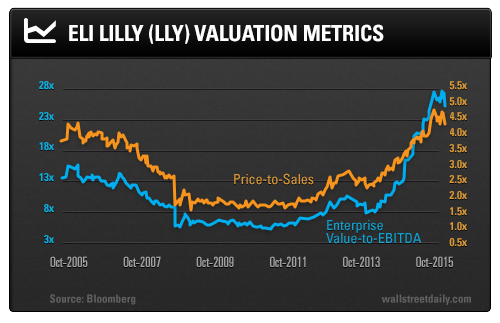
As a result, Eli Lilly’s valuation is now sky-high. The following chart shows Eli Lilly’s enterprise value-to-EBITDA multiple and price-to-sales ratio over the past 10 years:

Here, the effects of the healthcare/biotech boom are clearly evident as the company’s valuation has reached a stratospheric level in 2015.
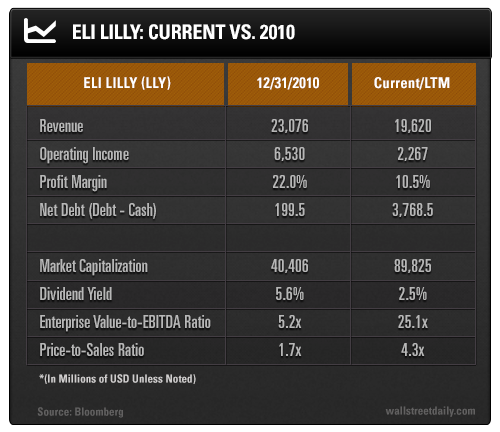
However, we can’t lose sight of the underlying fundamentals of the company when risk appetites in the market are so high. The following table compares various metrics for Eli Lilly to their levels at the end of 2010:

Eli Lilly’s revenue has actually declined over the past five years, in large part due to expiring patents. Operating profit has shrunk from $6.5 billion all the way down to $2.3 billion.
Meanwhile, Eli Lilly’s profit margin has been cut nearly in half. It’ll be very challenging to return margins to their prior levels for a variety of reasons. For example, the patent on Cialis, a high-margin erectile dysfunction drug, expires in 2017. Also, there’s been increased scrutiny on drug pricing in the media and on the Presidential campaign trail.
It seems as though Eli Lilly will need a few drugs from its internal development pipeline to become blockbusters just to prevent revenues and margins from deteriorating even further.
On top of all that, the company’s net debt (debt minus cash) has soared.
Because of these negative trends and slow growth prospects, Eli Lilly’s ridiculous valuation isn’t warranted. LLY isn’t a growth stock, but it is trading at growth stock multiples.
Unsurprisingly, most large caps with such high valuations – even those with higher growth – perform poorly. So, even if your heart is healthy enough for stock market activity, it’s best to stay away.
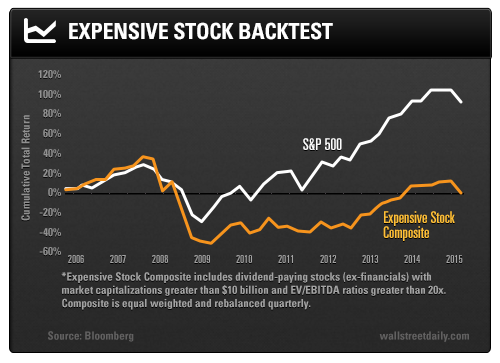
To drive this point home, I ran a backtest. Let’s just say someone went off their anti-psychotic medication and decided they were only going to own ultra-expensive, large-cap dividend payers.
The following chart shows the performance of dividend-paying stocks (ex-financials) with market caps greater than $10 billion and EV/EBITDA multiples greater than 20 times.

Over the past 10 years, you would have actually lost money if you followed a strategy of buying these richly valued stocks and equally weighting them in a portfolio every quarter. The S&P 500 had far better results.
Thus, if you hold LLY – or any overvalued dividend payer – for more than four hours, please seek medical attention immediately.
