Sears Holdings Corporation (Holdings) is the parent company of Kmart Holding Corporation (Kmart) and Sears, Roebuck and Co. (Sears). Holdings is broadline retailer with 2,201 full-line and 1,354 specialty retail stores in the United States operating through Kmart and Sears and 483 full-line and specialty retail stores in Canada operating through Sears Canada Inc.
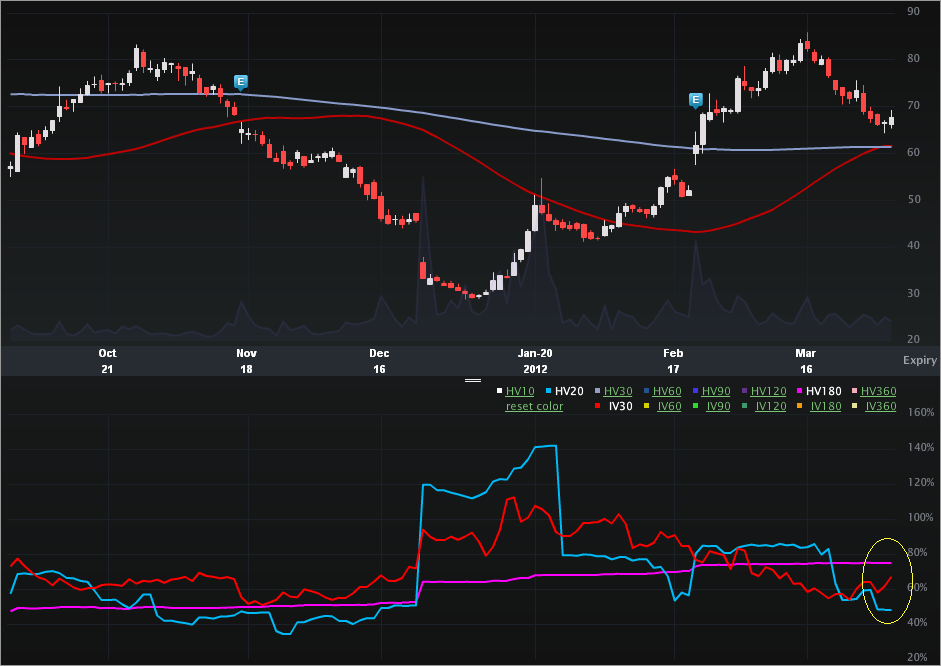
This is a vol note -- focusing both on the move today and in the near-term skew. Let's start with the Charts Tab (six months), below. The top portion is the stock price, the bottom is the vol (IV30™ - red vs HV20™ - blue vs HV180™ - pink).
On the stock side we can see that the stock price is actually almost exactly where it was six months ago, but the ride has been bumpy, seeing a six month closing low of $29.20 (1-6-2012), and a closing high of $83.43 (3-15-2012). The 52 wk range in SHLD is [$28.89, $87.66].
Looking to the vol, we can see a similarly bumpy ride, with an annual range in IV30™ of [31.82%, 112.46%], putting the current level in the 43rd percentile -- so pretty close to the middle. On 3-26-2012, IV30™ dropped to 53.87% and has risen since then by nearly 25% (~14 percentage points). Today the vol is up 9.3% on seemingly little news. But, it's the near-term skew comps that really caught my attention.
Let's turn to the Skew Tab.
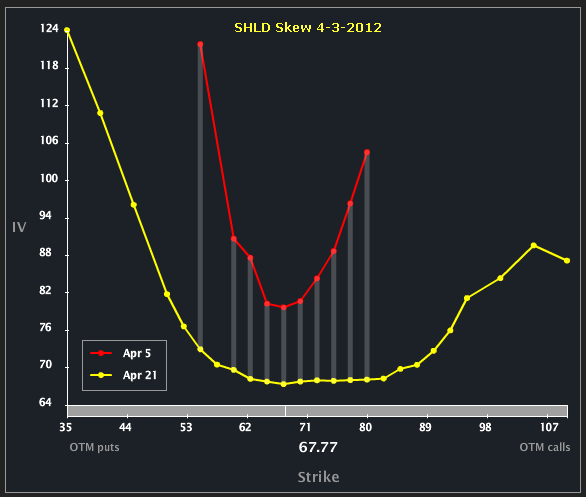
I've only included the weekly options expiring this Friday and the Apr monthlies. Both of these expiries show a parabolic skew, reflecting essentially equal risk of a downside slide or an upside pop. Much of that is tied to the fact that SHLD is perpetually hard-to-borrow (HTB).
Looking a bit closer at the skews, notice how the Apr monthly vols are flatter for more strikes relative to the rather abrupt upside skew in the weeklies. While the ATM vol is higher in the weeklies relative to the monthlies, that upside skew difference opens up an even larger vol diff.
Finally, let's turn to the Options Tab, below.
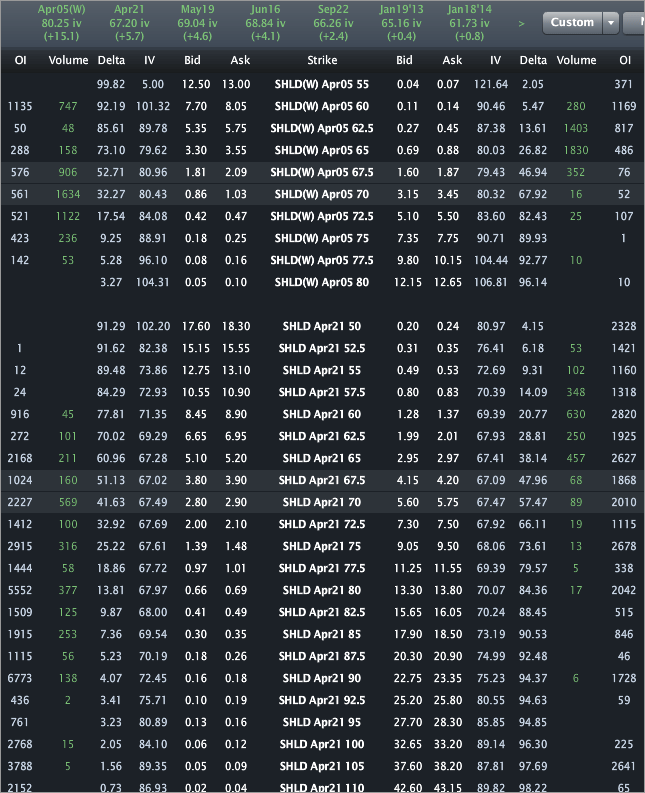
Assigning a single number to each expiration, we can see that Apr weeklies (80.25%) are priced about 13 vol points higher than the Apr monthlies (67.20%). But, walking up the strikes to the 75 line (for example), that vol diff opens to over 20%.
This is trade analysis, not a recommendation.
- English (UK)
- English (India)
- English (Canada)
- English (Australia)
- English (South Africa)
- English (Philippines)
- English (Nigeria)
- Deutsch
- Español (España)
- Español (México)
- Français
- Italiano
- Nederlands
- Português (Portugal)
- Polski
- Português (Brasil)
- Русский
- Türkçe
- العربية
- Ελληνικά
- Svenska
- Suomi
- עברית
- 日本語
- 한국어
- 简体中文
- 繁體中文
- Bahasa Indonesia
- Bahasa Melayu
- ไทย
- Tiếng Việt
- हिंदी
Sears Holdings (SHLD) - Vol Pops, Near-Term Skews Open Vol Diff To Upside
Published 04/04/2012, 04:23 AM
Updated 07/09/2023, 06:31 AM
Sears Holdings (SHLD) - Vol Pops, Near-Term Skews Open Vol Diff To Upside
3rd party Ad. Not an offer or recommendation by Investing.com. See disclosure here or
remove ads
.
Latest comments
Install Our App
Risk Disclosure: Trading in financial instruments and/or cryptocurrencies involves high risks including the risk of losing some, or all, of your investment amount, and may not be suitable for all investors. Prices of cryptocurrencies are extremely volatile and may be affected by external factors such as financial, regulatory or political events. Trading on margin increases the financial risks.
Before deciding to trade in financial instrument or cryptocurrencies you should be fully informed of the risks and costs associated with trading the financial markets, carefully consider your investment objectives, level of experience, and risk appetite, and seek professional advice where needed.
Fusion Media would like to remind you that the data contained in this website is not necessarily real-time nor accurate. The data and prices on the website are not necessarily provided by any market or exchange, but may be provided by market makers, and so prices may not be accurate and may differ from the actual price at any given market, meaning prices are indicative and not appropriate for trading purposes. Fusion Media and any provider of the data contained in this website will not accept liability for any loss or damage as a result of your trading, or your reliance on the information contained within this website.
It is prohibited to use, store, reproduce, display, modify, transmit or distribute the data contained in this website without the explicit prior written permission of Fusion Media and/or the data provider. All intellectual property rights are reserved by the providers and/or the exchange providing the data contained in this website.
Fusion Media may be compensated by the advertisers that appear on the website, based on your interaction with the advertisements or advertisers.
© 2007-2024 - Fusion Media Limited. All Rights Reserved.
