Upcoming US Events for Today:- Consumer Credit for July will be released at 3:00pm. The market expects $17.3B, consistent with the previous report.
Upcoming International Events for Today:
- German Trade Balance for July will be released at 2:00am EST. The market expects a surplus of €16.8B versus €16.6B previous.
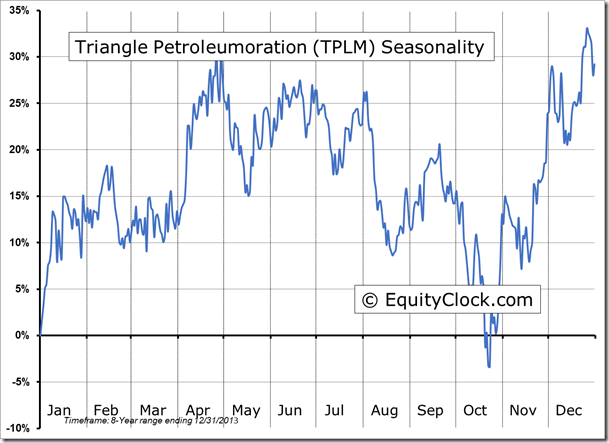
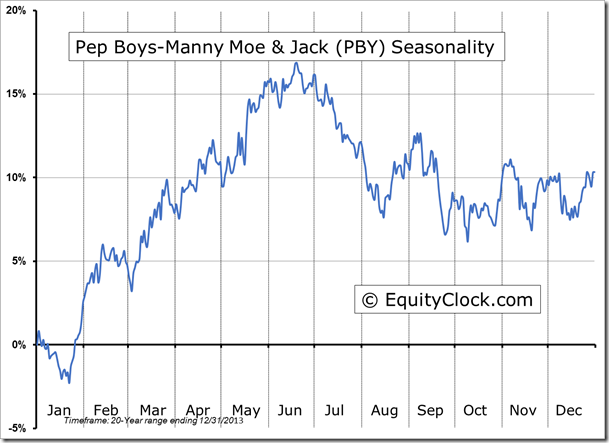
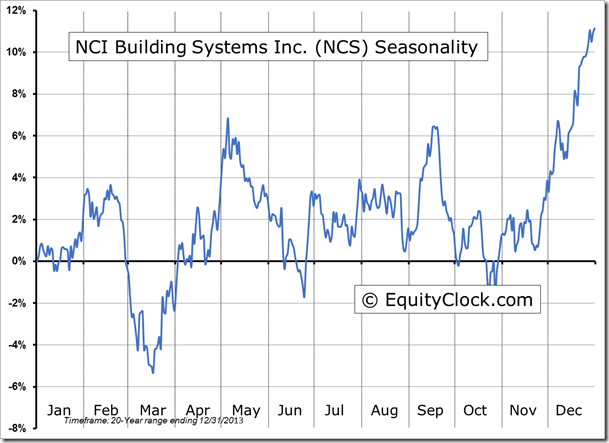
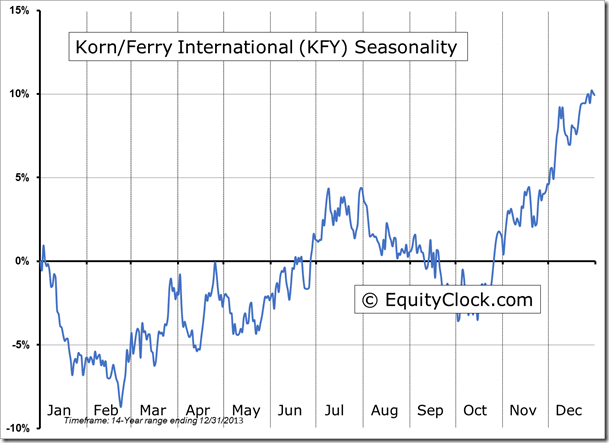
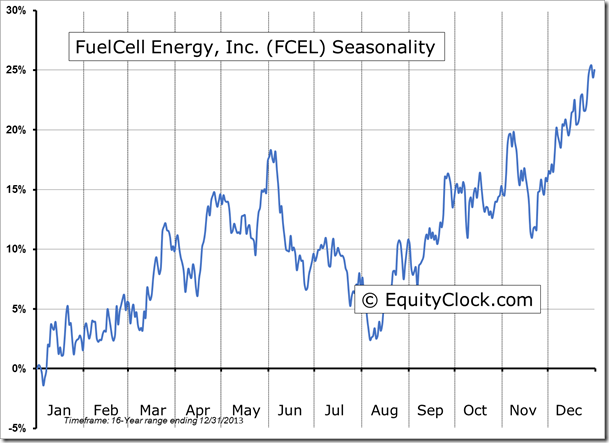
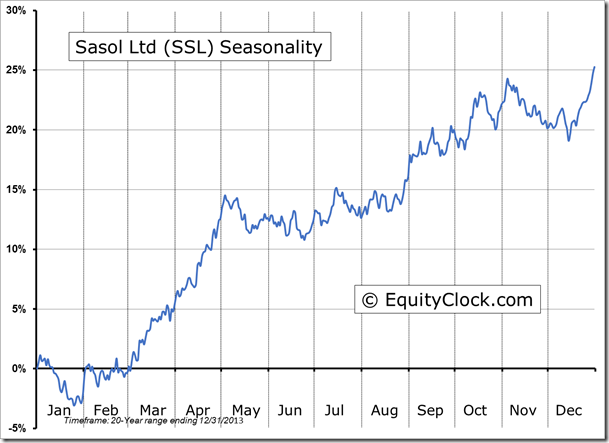
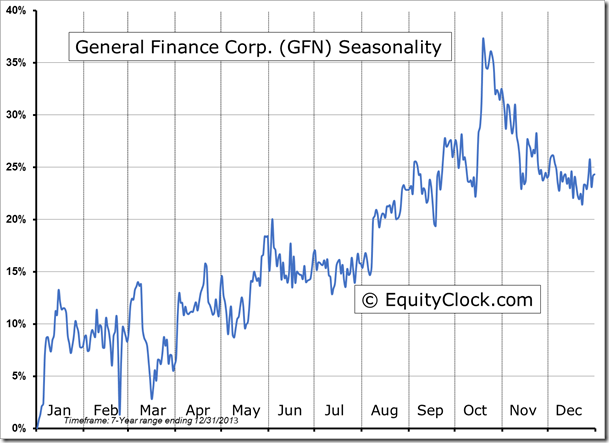
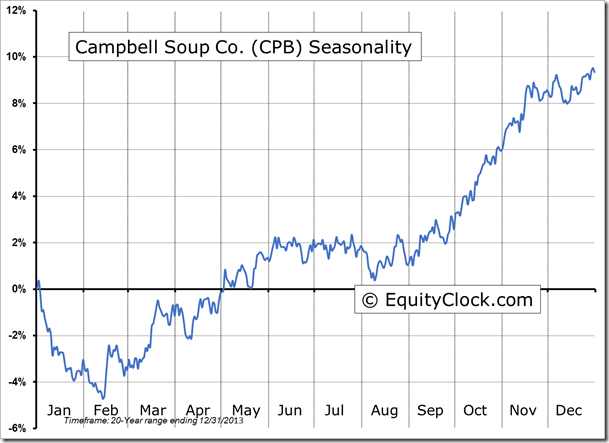
Seasonal charts of companies reporting earnings today:
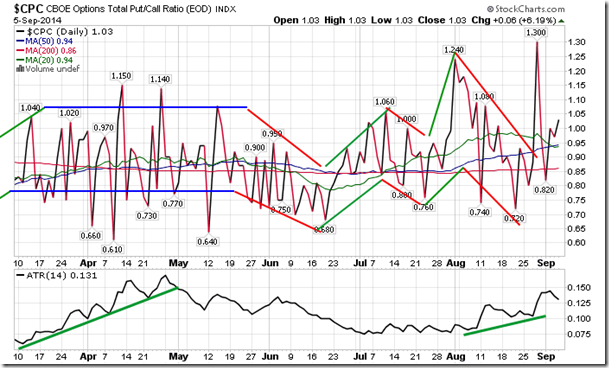
Sentiment on Friday, as gauged by the put-call ratio, ended bearish at 1.03.
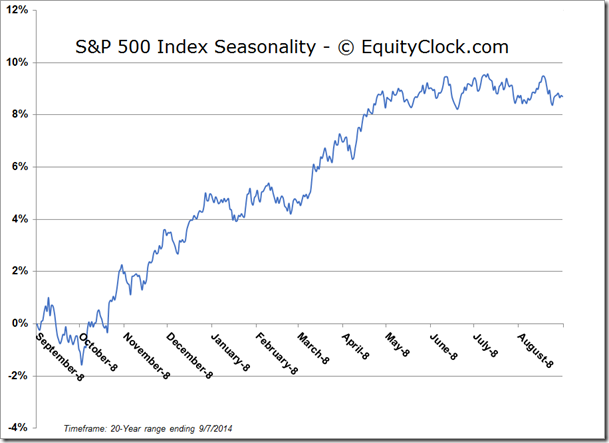
S&P 500 Index
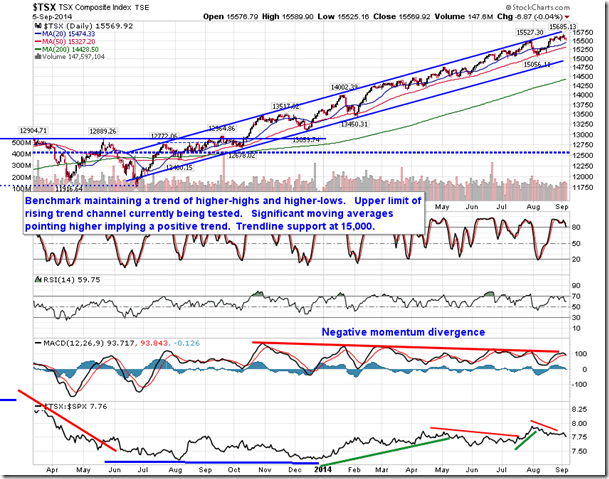
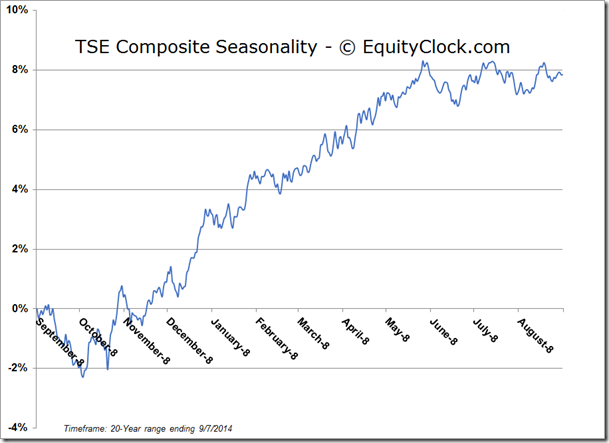
TSE Composite
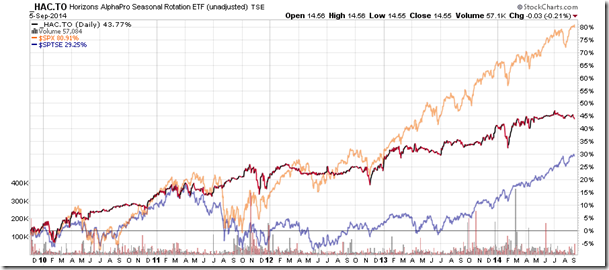
Horizons Seasonal Rotation ETF (TSX:HAC)
- Closing Market Value: $14.55 (down 0.21%)
- Closing NAV/Unit: $14.59 (up 0.30%)
Performance*
| 2014 Year-to-Date | Since Inception (Nov 19, 2009) | |
| HAC.TO | 2.03% | 45.9% |
* performance calculated on Closing NAV/Unit as provided by custodian
The Markets
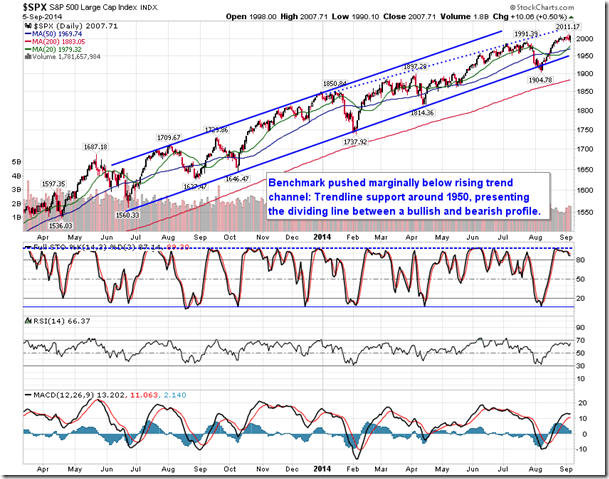
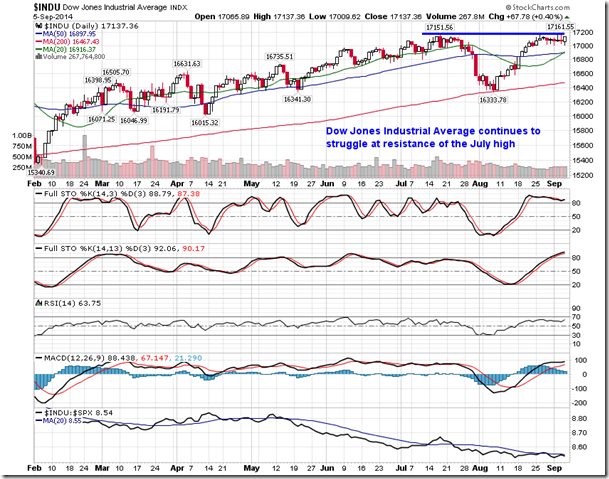
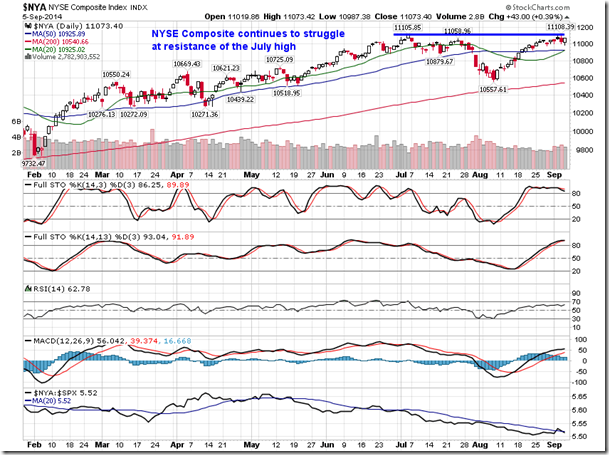
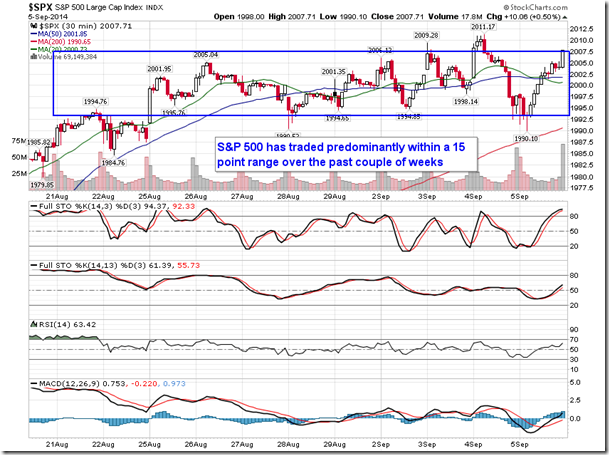
Stocks ended higher on Friday as investors reacted positively to August’s employment report. Despite a significantly weaker than expected increase in payrolls for the month, investors viewed the downbeat report as a sign that the Fed won’t be anxious to raise rates anytime soon. The S&P 500 pushed higher by half of one percent, charting a new all-time closing high; both the Dow Jones Industrial Average and NYSE Composite nudged back up against resistance of the summer highs as a breakout continues to elude these benchmarks. Momentum indicators for the major benchmarks continue to roll over, hinting of potential sell signals in the works as price shows signs of plateauing. Looking at a 30 minute chart of the S&P 500 Index, the benchmark has traded predominantly within a 15 point range over the past couple of weeks after initially hitting the widely talked about 2000 level; it is becoming clear a catalyst may be required to influence either a breakdown or breakout, providing direction to the market during what remains as the most volatile time of year.
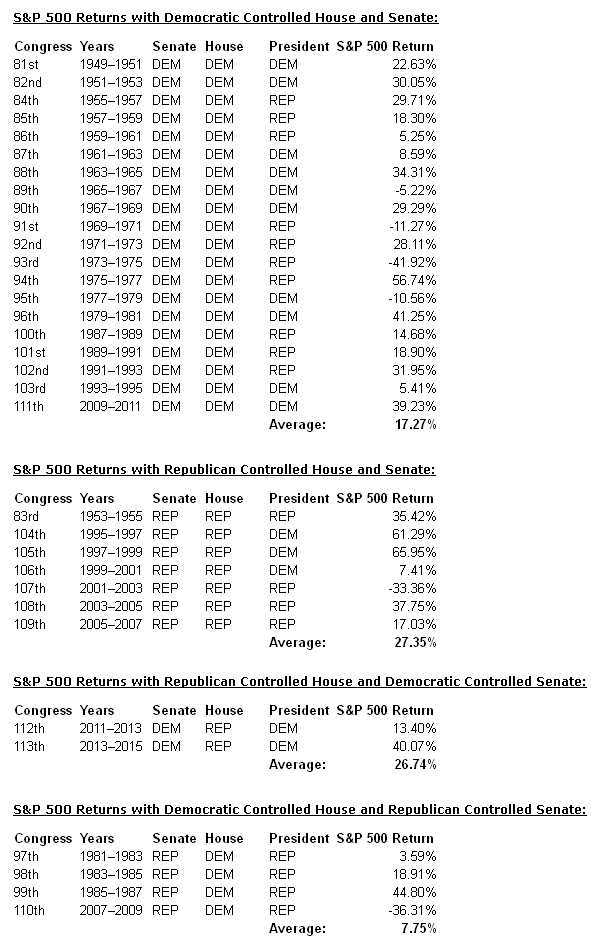
One catalyst that remains on the radar is the mid-term elections, which occur on November 4th. Talk remains focussed on the Republican party capturing both the house and the senate, potentially alleviating the bottlenecks in passing legislation. But how does the equity market react when the same party controls both the House and the Senate? The recent run in the equity markets that has seen a Republican controlled House and a Democratic controlled Senate has resulted in significant gains for the S&P 500 since the start of 2011. Despite the party politics, the large-cap benchmark has gained around 59% during the 112th and the 113th Congress. Still, the strong result pales in comparison to the returns during the 104th and 105th sessions of congress from 1995 to 1999 when the S&P 500 gained around 167% when the Republicans controlled both the House and the Senate, led by a Democratic president. Overall, terms in which Republicans controlled both the House and Senate have shown a history of strongly positive results for the equity market with the S&P 500 gaining an average of 27.35% since 1950; this compares to an average return of 17.27% for terms in which Democrats controlled both chambers. Conversely, the S&P 500 has averaged a mere 7.75% during terms in which the Republicans controlled the Senate and Democrats controlled the House. If past history is a guide for future equity market returns, a Republican controlled House and Senate, led by a Democratic President, may be a perfect scenario for equity investors.
S&P 500 Returns with Democratic Controlled House and Senate:
| Congress | Years | Senate | House | President | S&P 500 Return |
| 81st | 1949–1951 | DEM | DEM | DEM | 22.63% |
| 82nd | 1951–1953 | DEM | DEM | DEM | 30.05% |
| 84th | 1955–1957 | DEM | DEM | REP | 29.71% |
| 85th | 1957–1959 | DEM | DEM | REP | 18.30% |
| 86th | 1959–1961 | DEM | DEM | REP | 5.25% |
| 87th | 1961–1963 | DEM | DEM | DEM | 8.59% |
| 88th | 1963–1965 | DEM | DEM | DEM | 34.31% |
| 89th | 1965–1967 | DEM | DEM | DEM | -5.22% |
| 90th | 1967–1969 | DEM | DEM | DEM | 29.29% |
| 91st | 1969–1971 | DEM | DEM | REP | -11.27% |
| 92nd | 1971–1973 | DEM | DEM | REP | 28.11% |
| 93rd | 1973–1975 | DEM | DEM | REP | -41.92% |
| 94th | 1975–1977 | DEM | DEM | REP | 56.74% |
| 95th | 1977–1979 | DEM | DEM | DEM | -10.56% |
| 96th | 1979–1981 | DEM | DEM | DEM | 41.25% |
| 100th | 1987–1989 | DEM | DEM | REP | 14.68% |
| 101st | 1989–1991 | DEM | DEM | REP | 18.90% |
| 102nd | 1991–1993 | DEM | DEM | REP | 31.95% |
| 103rd | 1993–1995 | DEM | DEM | DEM | 5.41% |
| 111th | 2009–2011 | DEM | DEM | DEM | 39.23% |
| Average: | 17.27% |
S&P 500 Returns with Republican Controlled House and Senate:
| Congress | Years | Senate | House | President | S&P 500 Return |
| 83rd | 1953–1955 | REP | REP | REP | 35.42% |
| 104th | 1995–1997 | REP | REP | DEM | 61.29% |
| 105th | 1997–1999 | REP | REP | DEM | 65.95% |
| 106th | 1999–2001 | REP | REP | DEM | 7.41% |
| 107th | 2001–2003 | REP | REP | REP | -33.36% |
| 108th | 2003–2005 | REP | REP | REP | 37.75% |
| 109th | 2005–2007 | REP | REP | REP | 17.03% |
| Average: | 27.35% |
S&P 500 Returns with Republican Controlled House and Democratic Controlled Senate:
| Congress | Years | Senate | House | President | S&P 500 Return |
| 112th | 2011–2013 | DEM | REP | DEM | 13.40% |
| 113th | 2013–2015 | DEM | REP | DEM | 40.07% |
| Average: | 26.74% |
S&P 500 Returns with Democratic Controlled House and Republican Controlled Senate:
| Congress | Years | Senate | House | President | S&P 500 Return |
| 97th | 1981–1983 | REP | DEM | REP | 3.59% |
| 98th | 1983–1985 | REP | DEM | REP | 18.91% |
| 99th | 1985–1987 | REP | DEM | REP | 44.80% |
| 110th | 2007–2009 | REP | DEM | REP | -36.31% |
