Upcoming US Events for Today:- Consumer Price Index for July will be released at 8:30am. The market expects a month-over-month increase of 0.1% versus an increase of 0.3% previous. Less Food and Energy, the increase is expected to show 0.2% versus an increase of 0.1% previous.
- Housing Starts for July will be released at 8:30am. The market expects 963K versus 893K previous.
Upcoming International Events for Today:
- Great Britain CPI for July will be released at 4:30am EST. The market expects a year-over-year increase of 1.8% versus an increase of 1.9% previous.
- Japan Trade Balance for July will be released at 7:50pm EST. The market expects a deficit of ¥702.5B versus a deficit of ¥822.2B previous.

The Markets
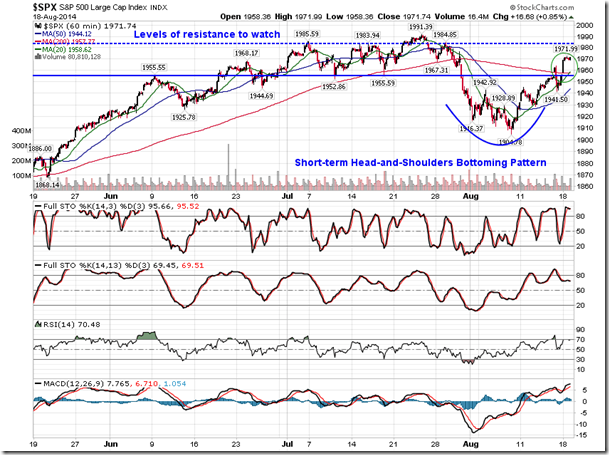
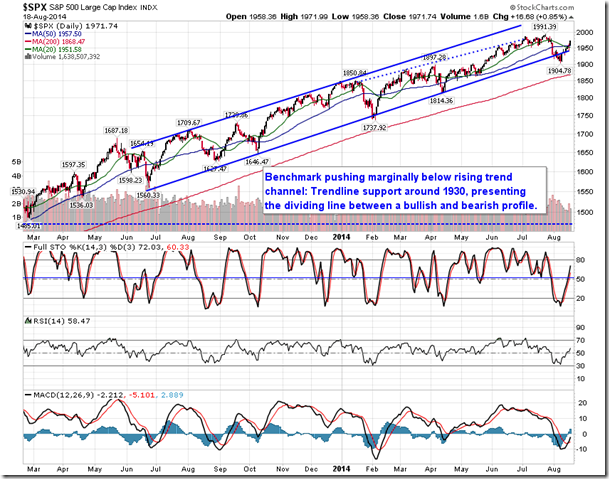
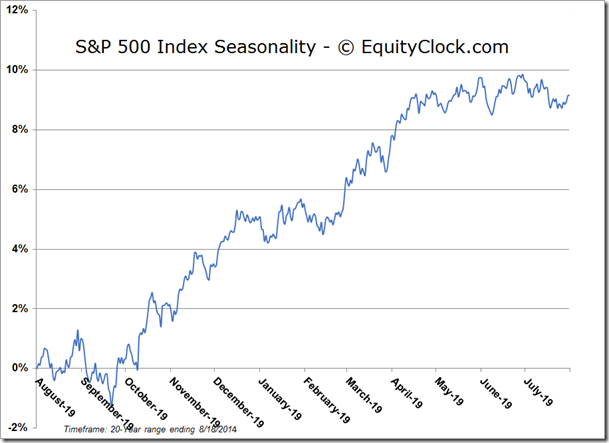
Stocks surged on Monday as geopolitical concerns continued to wane. The S&P 500 broke above resistance at 1955, as well as the 50-day moving average, recouping the majority of the losses accumulated since the end of July. The gain in the large-cap benchmark of over 16 points easily fulfilled the target implied by the reverse head-and-shoulders bottoming pattern, which had become apparent during the first couple weeks of the month. Next level of resistance standing in the way of new highs is 1985, followed by the all-time high at 1991. Momentum indicators for the S&P 500 Index are currently pointing higher after recovering from oversold levels.The volume of shares trading hands remains light, a typical characteristic of summer trading. Janet Yellen’s speech on Friday in Jackson Hole, Wyoming may be the next major catalyst for this market, likely providing the direction for equities through the end of the month.
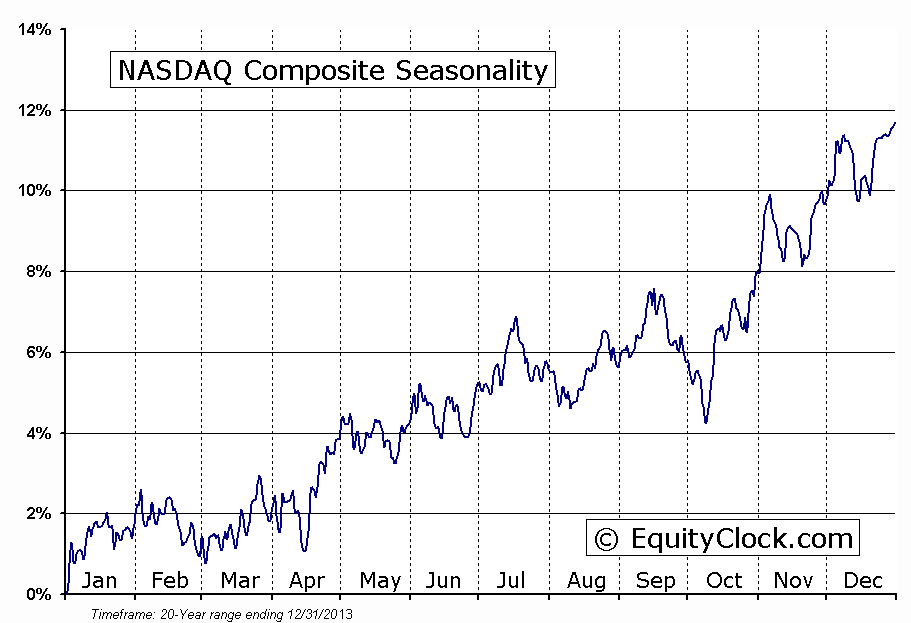
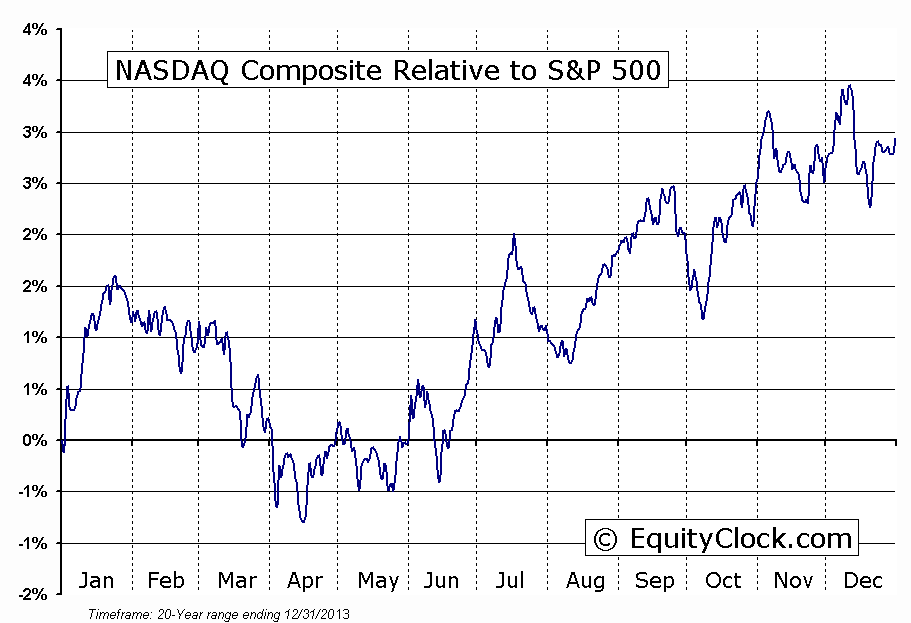
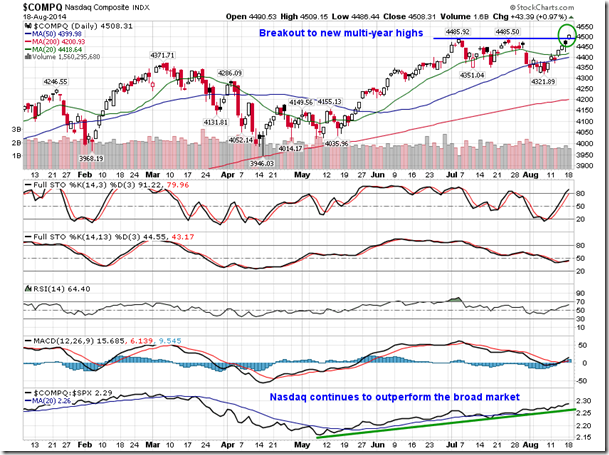
With the gains on the day, the Nasdaq Composite broke out to new multi-year highs, overcoming double-top resistance around 4485. This is the highest level the benchmark has traded since April of 2000, just following the peak of the tech bubble in March of that year. The composite now remains around 12% below the all-time high of 5132. The Nasdaq has been outperforming the broad market since May of this year, just following the selloff in momentum stocks that acted as a drag on the technology heavy benchmark in March and April. Over the past 20 years, outperformance of the Nasdaq versus the S&P 500 has become the norm between May and January, a trend that appears to be well underway this year as well. Whereas the S&P has averaged a flat return during the summer season, the Nasdaq has recorded a gain over this period, returning 2.32%, on average, by the third week in September.
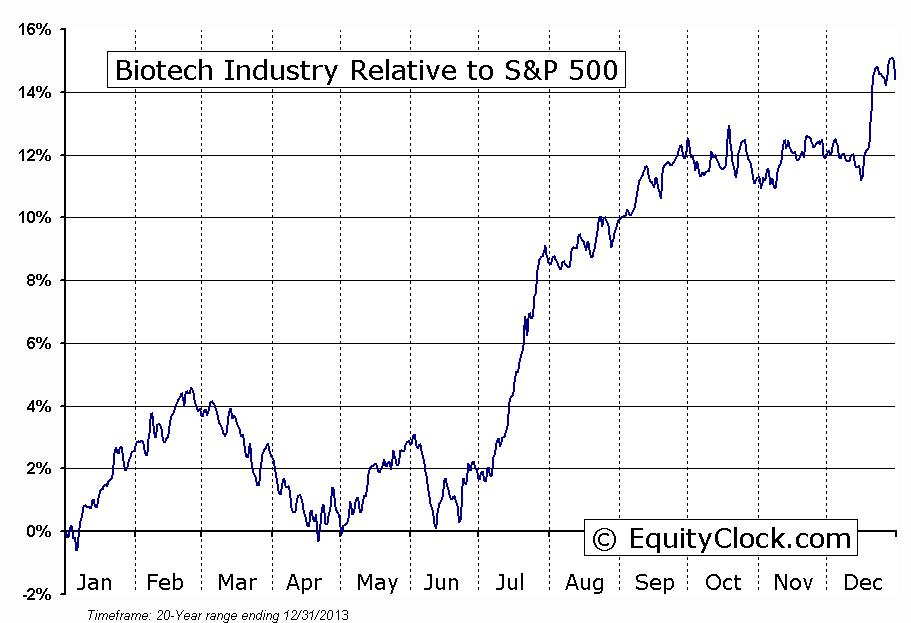
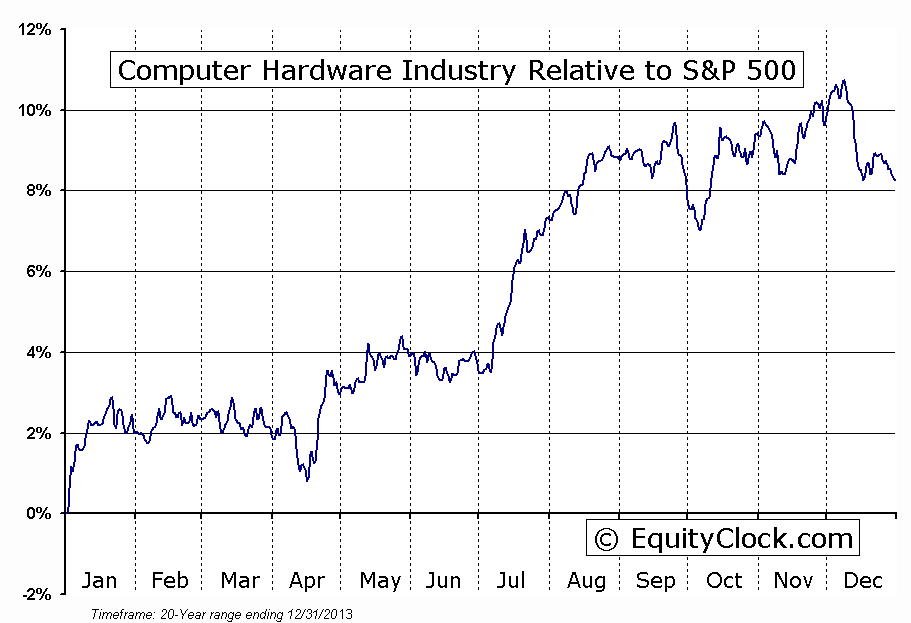
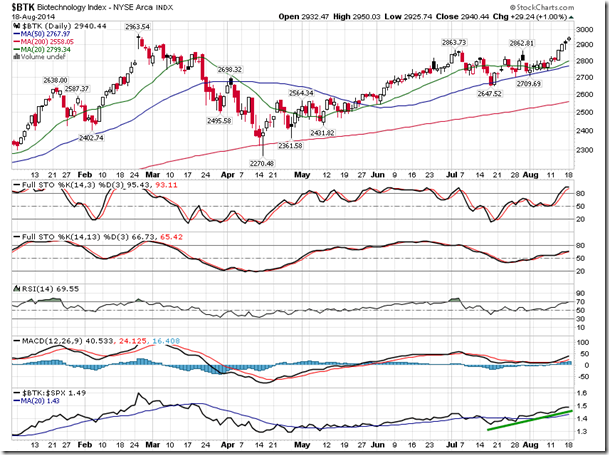
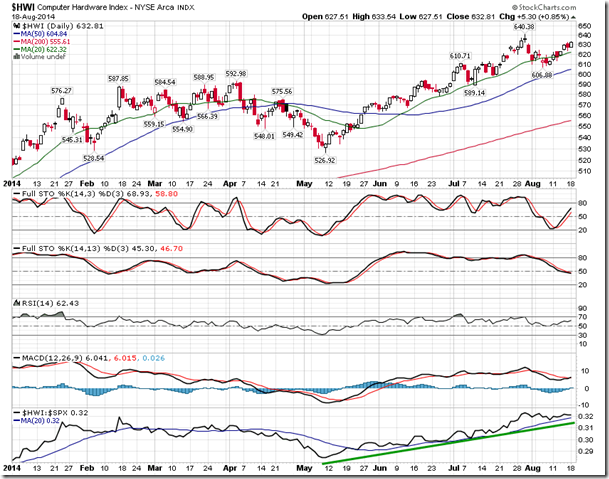
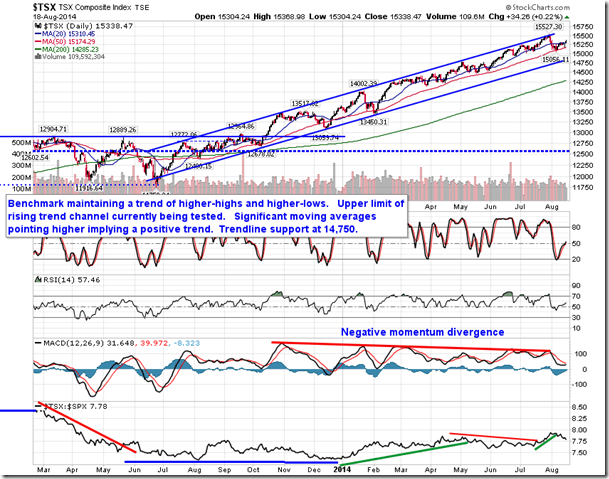
Outperformance in the NASDAQ Composite during the summer months is attributed to strength in the biotechnology and computer hardware industries, trends that are playing out well this year. Seasonal strength customarily peaks ahead of the third quarter earnings season, leading to short term weakness into early October, which allows for appealing buying opportunities for the period of seasonal strength for the broad technology sector during the fourth quarter. Significant moving averages for each industry benchmark continue to point higher, implying positive trends across multiple timescales.
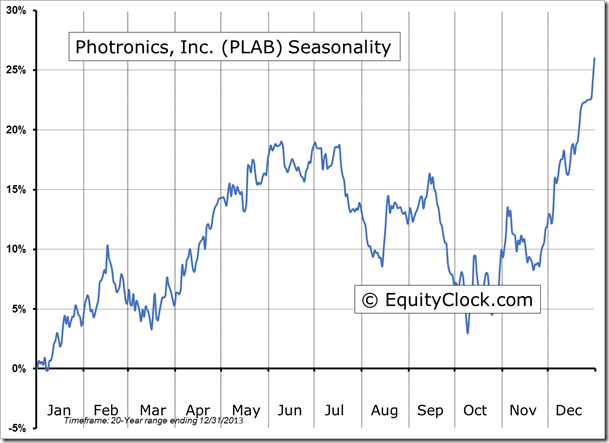
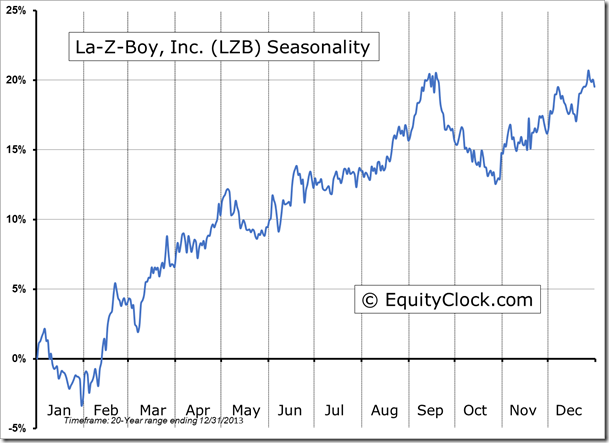
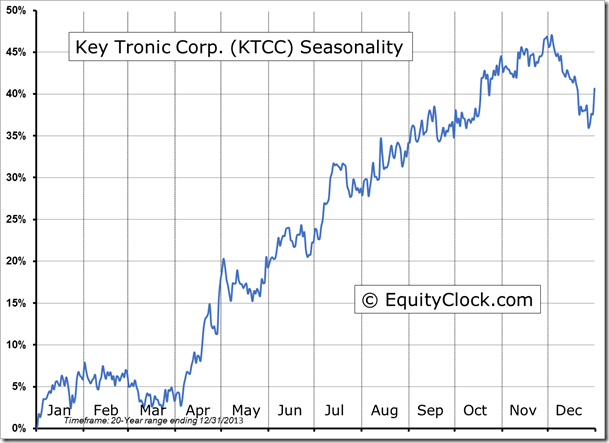
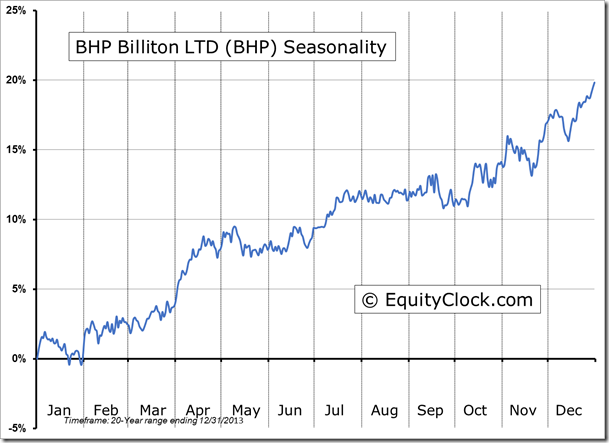
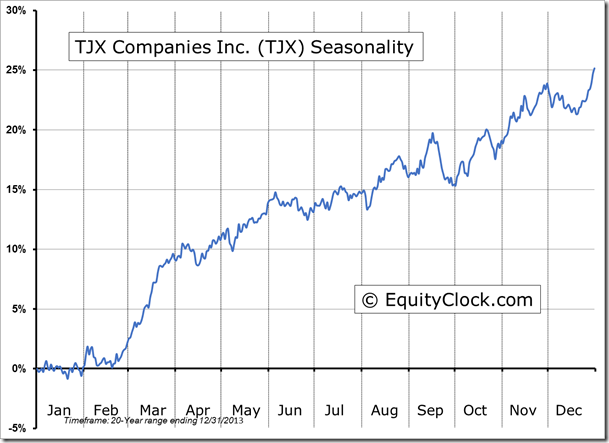
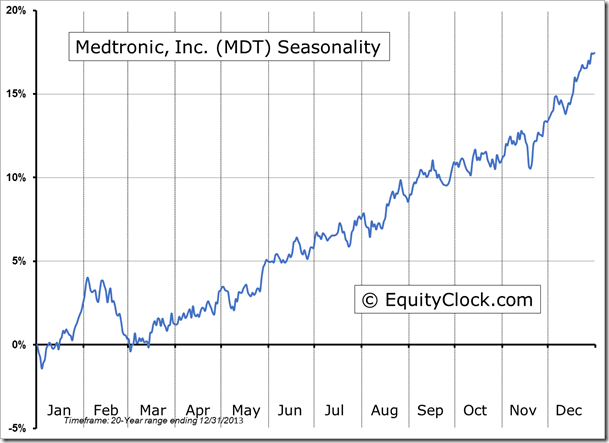
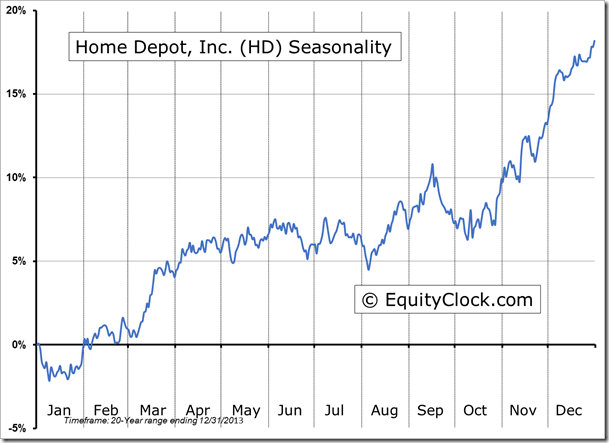
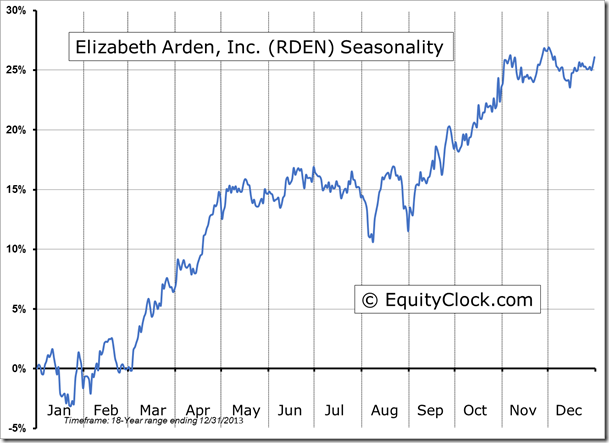
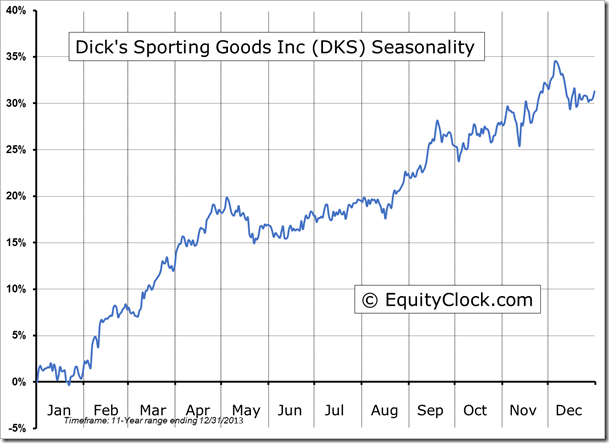
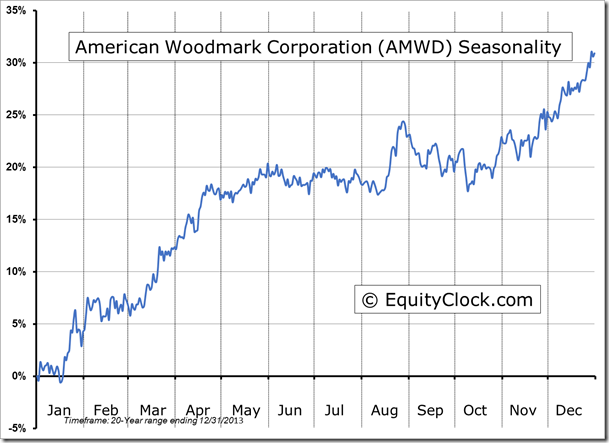
Seasonal charts of companies reporting earnings today:
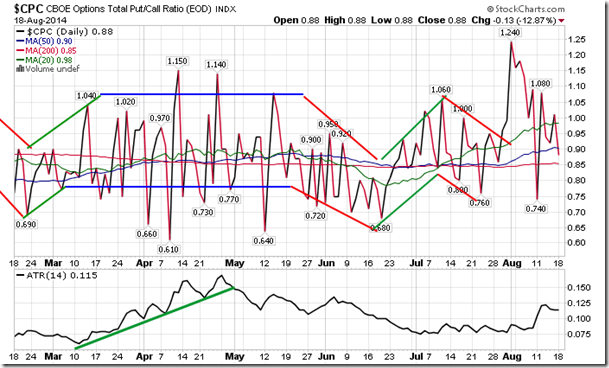
Sentiment on Monday, as gauged by the put-call ratio, ended bullish at 0.88.
S&P 500 Index
TSE Composite
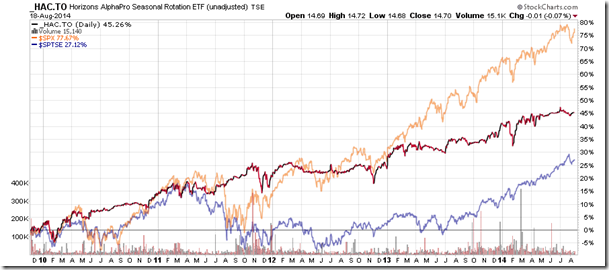
Horizons Seasonal Rotation ETF (TSX:HAC)
- Closing Market Value: $14.70 (down 0.07%)
- Closing NAV/Unit: $14.71 (up 0.06%)
Performance*
| 2014 Year-to-Date | Since Inception (Nov 19, 2009) | |
| HAC.TO | 2.87% | 47.1% |
* performance calculated on Closing NAV/Unit as provided by custodian
