
- 30 to 90 days horizons SPX: Long SPX on 12/11/13 at 1782.22.
- Monitoring purposes GOLD: Gold ETF GLD long at 173.59 on 9/21/11
- Long-Term Trend monitor purposes: Flat.
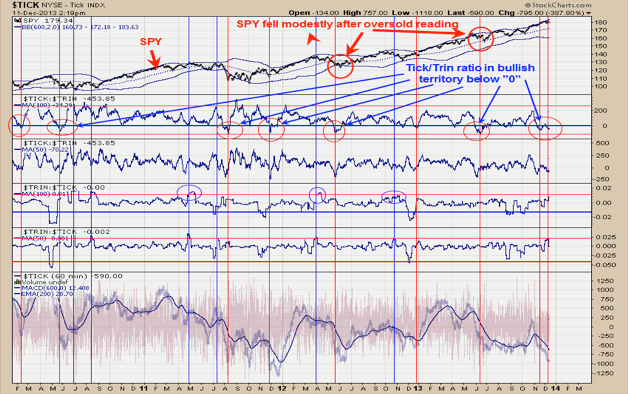
The top window in the chart above is the SPY and the window below that is the TICK/TRIN ratio. This chart dates back to early 2010 about four years of data. When the Tick/TRIN ratio falls below the “0” line (like now) than the price damage is done or nearly done. We have circled in blue the two times in the last four years where the SPY did pull back modestly more before heading higher even with the ratio in bullish below “0” territory. We posted on yesterday’s report a Seasonality chart for December which showed if there is going to be a pullback it should appear this week and that looks to be the case. The FOMC meeting is December 17 and 18 (next Tuesday and Wednesday) and market may not turn up until then. Today the Trin closed at 1.62 and the ticks closed at -718 and that combination have lead to short term bottom the same day of the reading to as late as two days later which would be Friday. With the above chart in bullish territory and also the chart on page two, we elected to go long on tonight close. Long SPX on (12/11/13) at 1782.22.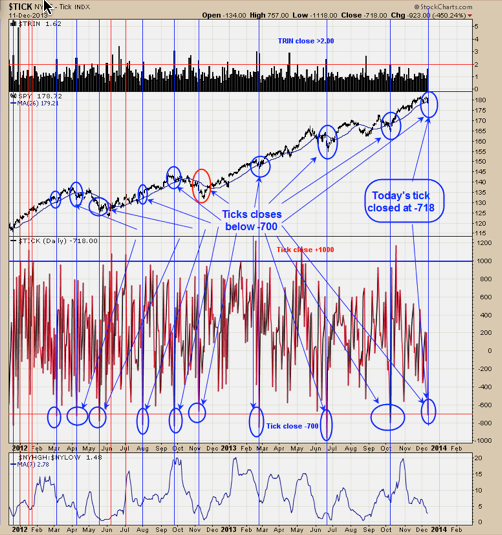
Above is a closing Tick chart going back over two years. Previous instances when the Tick closed below -700 the SPX was at bottom or extremely close to a bottom. If the Tick closed higher than -500 today we may have wait to go long the SPX tomorrow or Friday. There was an instance back in November 2012 (Circled in Red) that the Tick reached near minus 700 and market still pushed modestly lower but was still near a significant low. We where looking for the 1775 range on the SPX to be tested and it still may be tested, but in general that area should hold as support. Long SPX on 12/11/13 at 1782.22.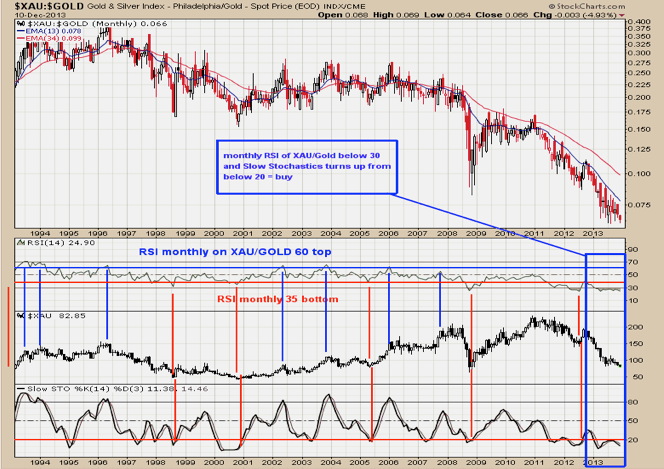
The Commitment of Traders report (COT) for Gold show the Commercials in as a bullish position as the June low. Most sentiment readings for Gold are near extreme negative which is a contrarian indicator and suggesting gold is near a low. The above chart is the monthly XAU/Gold ratio. In general when this ratio is trending up it a bullish sign for both gold and Gold stocks and vice versa. When the RSI of this ratio reaches above 60 than gold and gold stocks are near a high. When the RSI of this ratio reach below 35 than condition suggests a bottom is not far off for gold and gold stocks.. The current RSI reading for this ratio is 24.91 and has stayed there most of 2013. The bottom window is the monthly Slow Stochastics for the XAU/Gold ratio. Bullish signals have been triggered when this indicator turns up from below 20. The current reading is 11.38 and in bullish territory but needs to close above 20 to trigger the bullish signal. Both monthly RSI and Slow Stochastics are in bullish territory but signal will come when these two indicators turn up. For now there is nothing to do but wait but there are bullish signs developing here. Long GDX on 11/14/13 at 24.55 stopped at 23.63 for loss a 3.75% loss. Long GDX on 10/15/13 at 23.69; stopped for gain of 4.3%.
Long NG at 5.14 on 10/8/12. Long GDX 58.65 on 12/6/11. Long GDXJ average 29.75 on 4/27/12. Long GLD at 173.59 on 9/21/11. Long BRD at 1.67 on 8/3/11. Long YNGFF .44 on 7/6/11. Long EGI at 2.16, on 6/30/11. Long GLD at 147.14 on 6/29/11; stop 170 hit = gain 15.5% . Long KBX at 1.13 on 11/9/10. Long LODE at 2.85 on 1/21/11. Long UEXCF at 2.07 on 1/5/11. We will hold as our core position in AUQ, CDE and KGC because in the longer term view these issues will head much higher. Holding CDE (average long at 27.7. Long cryxf at 1.82 on 2/5/08. KGC long at 6.07. Long AUQ average of 8.25.