
SPX broke 1660 area resistance on Friday afternoon and closed the day at 1667.47 SPX. On the SPX 60min chart the current rising channel from the 1536 low is still in play and support there is in the 1640 area, with resistance now in the 1675 area: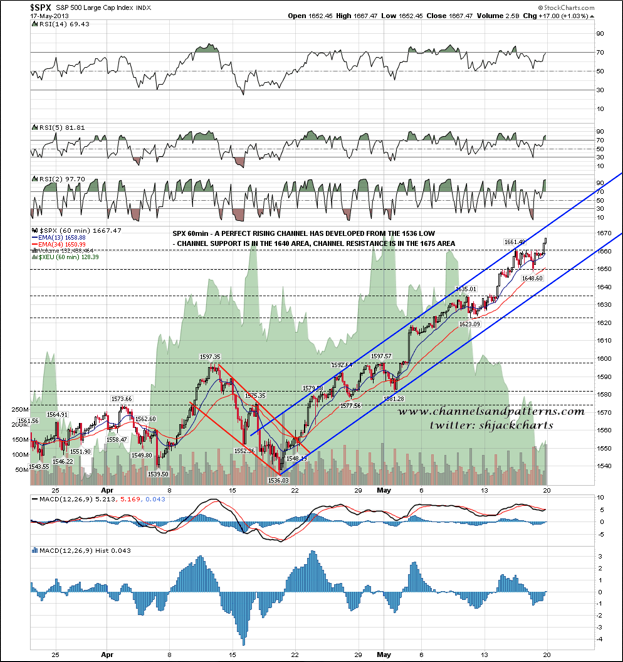
The ES 60min chart looks similar and as with SPX, there’s nothing here suggesting reversal in the short term: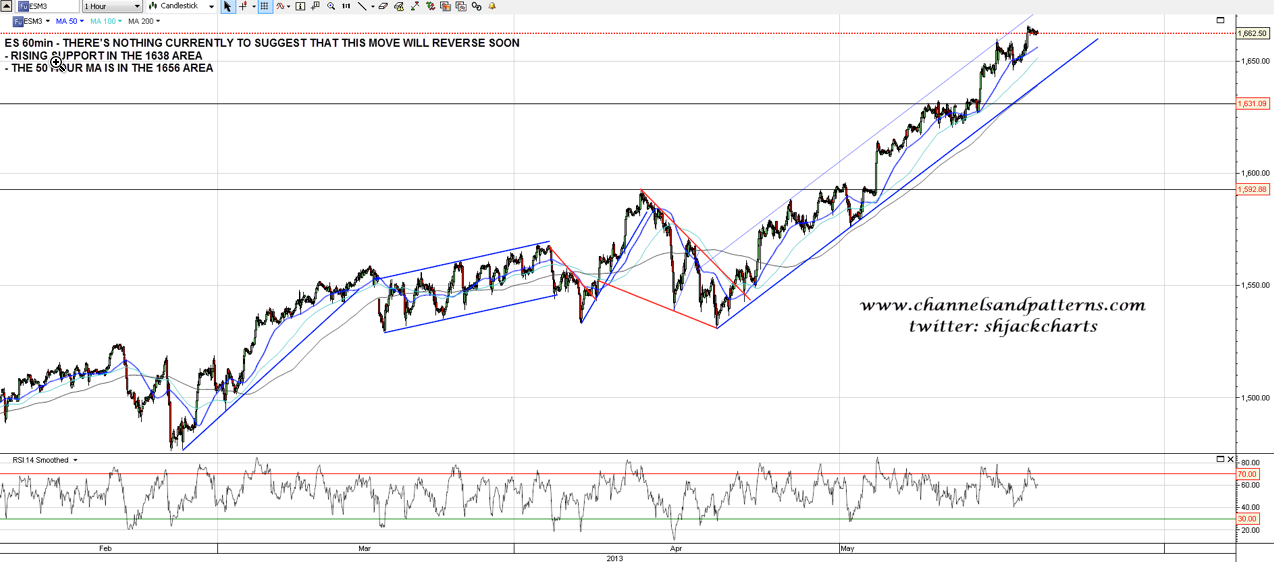
On the SPX daily chart Friday’s close was still six points below the daily upper bollinger band at 1673. Also worth noting on this chart is that the channel from the November low was thoroughly retested after the break above it, which looks strong: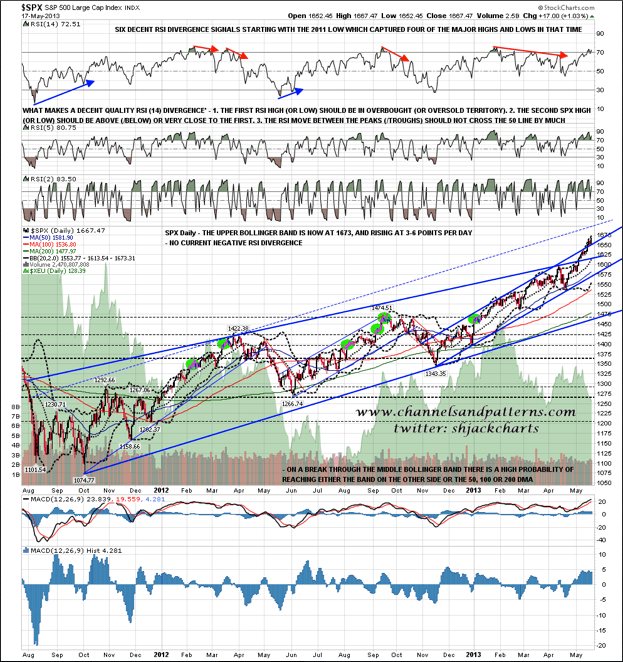
The thing that surprised me last week though was the break above the weekly upper bollinger band. it’s not unusual to close above this on the monthly or daily charts, but it’s a rarity on the weekly chart, at least since the 2009 low. I’ll be looking back 20 years and working up some stats for tomorrow but meantime the upper bollinger band can only rise at 10-12 points per week I think, and so SPX is already above where I would expect the weekly upper bollinger band to close this week. It’s time to start looking at the next trendline resistance levels however, and they are in the 1690-1720 area as you can see on the chart below: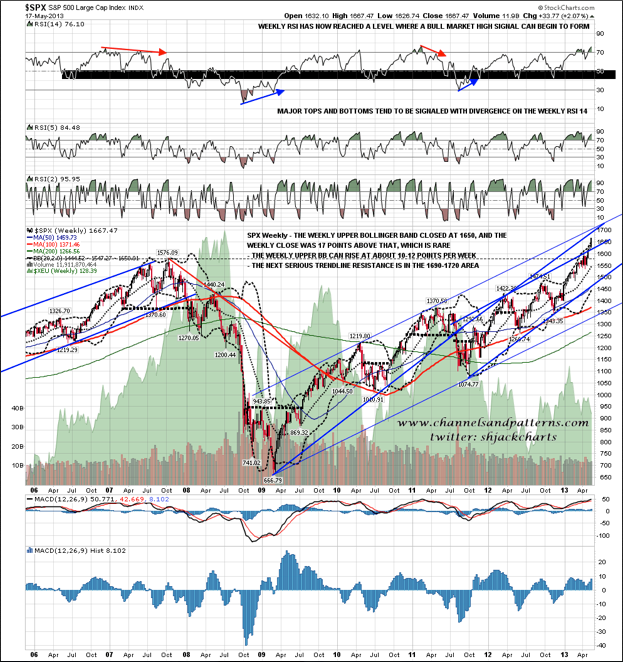
Currencies and commodities are an easier call than equities at this stage, and today I’m looking at the current inflection point of oil on the USO 60-min. chart. Here you can see the broadening descending wedge that has been building on USO in 2009, and we’re still seeing whether oil will reverse back down here. I can’t see an obvious reversal pattern forming here though a double-top could be forming of course: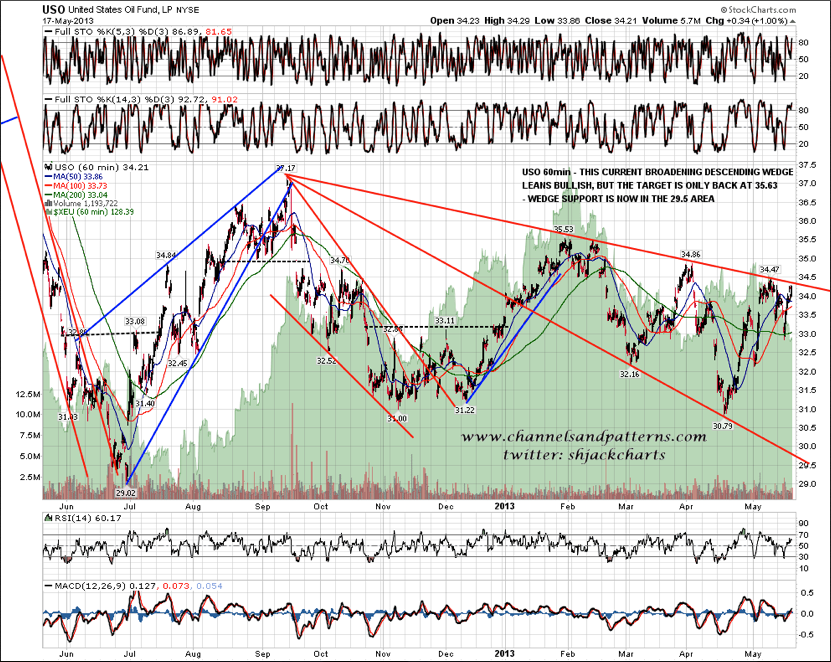
I’ve been watching a number of currencies against USD to see whether they support or weaken my scenario where we see USD rise a lot from here over the next year or two. AUDUSD can just made a break that strongly favors this strong USD scenario as it broke below a two year triangle last week. The triangle target is the 2010 low in the 81 area, though there is strong established support in the 93/4 area: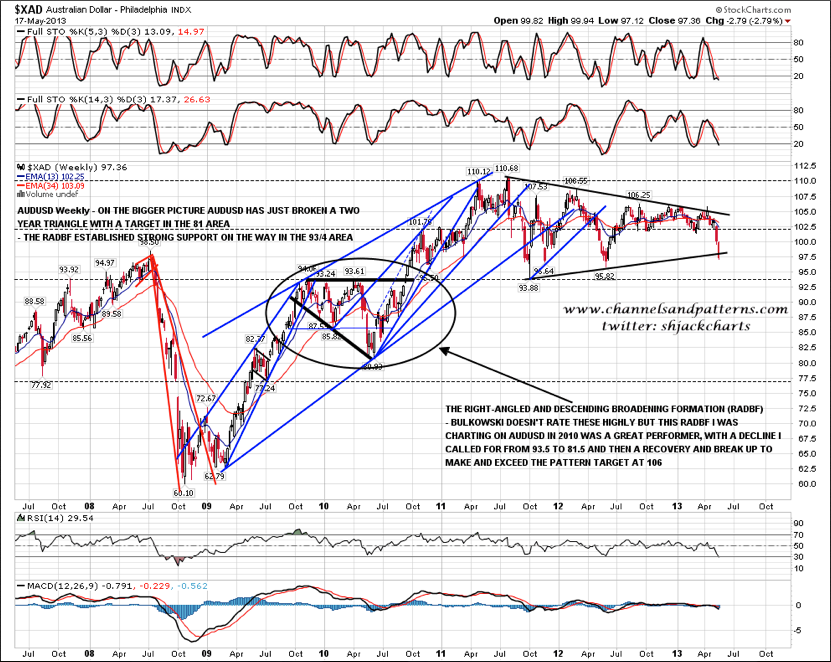
The next, and frankly the last, significant trendline resistance levels on SPX are now in the 1690-1720 area, and SPX is now close enough that those are an obvious target from here. Meantime SPX looks very stretched here, but I can see nothing short term to suggest reversal. At the least with SPX this stretched we should see SPX slowing this upwards spike but as yet there’s not much sign of that either.
- English (UK)
- English (India)
- English (Canada)
- English (Australia)
- English (South Africa)
- English (Philippines)
- English (Nigeria)
- Deutsch
- Español (España)
- Español (México)
- Français
- Italiano
- Nederlands
- Português (Portugal)
- Polski
- Português (Brasil)
- Русский
- Türkçe
- العربية
- Ελληνικά
- Svenska
- Suomi
- עברית
- 日本語
- 한국어
- 简体中文
- 繁體中文
- Bahasa Indonesia
- Bahasa Melayu
- ไทย
- Tiếng Việt
- हिंदी
S&P 500: The Next level
Published 05/20/2013, 10:42 AM
Updated 07/09/2023, 06:31 AM
S&P 500: The Next level
3rd party Ad. Not an offer or recommendation by Investing.com. See disclosure here or
remove ads
.
Latest comments
Install Our App
Risk Disclosure: Trading in financial instruments and/or cryptocurrencies involves high risks including the risk of losing some, or all, of your investment amount, and may not be suitable for all investors. Prices of cryptocurrencies are extremely volatile and may be affected by external factors such as financial, regulatory or political events. Trading on margin increases the financial risks.
Before deciding to trade in financial instrument or cryptocurrencies you should be fully informed of the risks and costs associated with trading the financial markets, carefully consider your investment objectives, level of experience, and risk appetite, and seek professional advice where needed.
Fusion Media would like to remind you that the data contained in this website is not necessarily real-time nor accurate. The data and prices on the website are not necessarily provided by any market or exchange, but may be provided by market makers, and so prices may not be accurate and may differ from the actual price at any given market, meaning prices are indicative and not appropriate for trading purposes. Fusion Media and any provider of the data contained in this website will not accept liability for any loss or damage as a result of your trading, or your reliance on the information contained within this website.
It is prohibited to use, store, reproduce, display, modify, transmit or distribute the data contained in this website without the explicit prior written permission of Fusion Media and/or the data provider. All intellectual property rights are reserved by the providers and/or the exchange providing the data contained in this website.
Fusion Media may be compensated by the advertisers that appear on the website, based on your interaction with the advertisements or advertisers.
© 2007-2024 - Fusion Media Limited. All Rights Reserved.