
T2108 Status: 55.2%
T2107 Status: 49.7%
VIX Status: 14.9 (jumped above 15.35 pivot at one point)
General (Short-term) Trading Call: Hold.
Active T2108 periods: Day #36 over 20%, Day #34 over 30%, Day #31 over 40%, Day #29 over 50% (overperiod), Day #4 under 60% (underperiod), Day #106 under 70%
Commentary
The stock market threw me for another loop yesterday. After sounding a loud bearish alarm in the last T2108 Update, I was prepared for Tuesday’s bearish open. I was however NOT prepared for the rapid and convincing bounce back from the lows.
T2108 dropped as low as 47.5% while the S&P 500 plunged in the first hour of trading almost to its lower-Bollinger® Band (BB). The volatility index soared above the 15.35 pivot point. It was all looking like convincing follow-through for the bears. However, I think the currency market helped throw the day for a loop.
The Japanese yen had been gaining strength throughout the Asian and European trading sessions. Perhaps it was a race to cover shorts, perhaps stops were getting taken out. Whatever it was, the strength in the yen accelerated in the first hour of U.S. trading. It led to a classic V-shaped bottom where the recovery was as swift as the bumrush to the bottom. The S&P 500 and the U.S. dollar (DXY) versus the Japanese yen (via RYDEX CurrencyShares Japanese Yen ETF (ARCA:FXY)) bottomed together. Buyers never looked back as they ran stocks right back up the flagpole.
The S&P 500 managed to finish with a mere 1-point loss. The day ended up looking like much ado about nothing. It left behind a very long hammer pattern. If buyers manage to keep the index pushing to a higher close, suddenly the market will look like it just washed out another set of weak hands.

The S&P 500 prints a hammer as encouraging as the selling the day before was ominous

A perfectly synchronized bottom between the S&P 500 and the Japanese yen currency crosses
(In the chart above, the top line (red) is the S&P 500. The thick, middle, black line is AUD/JPY. The bottom, blue line is USD/JPY).
Encouragement from the currency market came in the form of the Australian dollar (via Rydex CurrencyShares AUD Trust (NYSE:FXA)) versus the Japanese yen (AUD/JPY) stopping cold at 50DMA support. This is a bullish development that now awaits confirmation with follow-through.

Another encouraging sign: the Australian dollar versus the Japanese yen stopped cold at 50DMA support
As you can imagine, with all the early commotion trading opportunities abounded. The following notes, excluding iShares MSCI Emerging Markets (ARCA:EEM), are all updates from my last T2108 Update.
First off, I immediately sold my put options on ProShares Ultra VIX Short-Term Futures (ARCA:UVXY) into the early swoosh downward. UVXY was up another 10% or so at the time. As I mentioned earlier, I held onto the put options one more day given the ominous warnings from the market, but I also had little confidence UVXY could hold its value through the week. UVXY closed the day with just a 2% gain.
Next, I made the TOUGH decision to sell my ProShares Ultra S&P500 (ARCA:SSO) shares. While I was supposed to wait for the close, I decided that the open looked ominous enough that it was not worth further risk to my profits to hold SSO longer. Again, my expectation through the balance of this month is for a lot of chop.
I stayed firm with the trading strategy from the Apple Trading Model (ATM). With odds favoring a positive close and a positive move from the open, I immediately bought call options. I sold them for a small gain into the first pop and put in another limit order. Fortuitously, the second order triggered, and I held on until just ahead of the close. While I was playing the odds from the ATM, I definitely did not expect such a healthy gain at the close after such an ugly open.
Apple (NASDAQ:AAPL) ALMOST pulled off a bullish engulfing move. I am tempted to call it “close enough.”

AAPL not only makes a resounding comeback, but also the stock prints a gain producing very convincing relative strength
A stock that DID print a bullish engulfing pattern was Alibaba (NYSE:BABA). And just like the UVXY trade the day before, I almost missed the trade while tweeting about it.

Soon after this tweet, I realized that this was a low risk (a tight and well-defined stop)/ high reward setup. I was a little late hopping aboard as I should have been ready right at the moment of the retest. BABA ended up closing with a bullish engulfing pattern that marks a likely bottom. I am now warily eyeing the downtrend line as potential resistance (meaning I could decide to take profits at anytime from here).

A picture-perfect bounce from the 50DMA which completed the reversal of all post-earnings gains
Finally, I initiated a fresh pairs trade on iShares MSCI Emerging Markets (EEM). The gap down was a perfect opportunity to buy more call options on EEM on the cheap. I bought a smaller contingent of put options as a hedge. I am looking for more big moves from EEM.
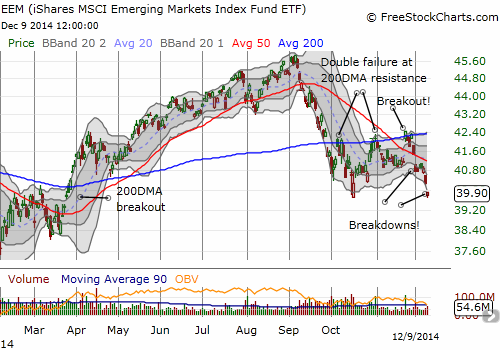
Another gap down for EEM confirms current bearishness
I changed the trading strategy back to hold for bulls and bears. Bears can hold onto fresh shorts until buyers can prove they have firepower to push through a notable, fresh all-time high. Bulls do not need to lock in profits on any other positions unless/until today’s low gets violated.
Daily T2108 vs the S&P 500")
Black line: T2108 (measured on the right); Green line: S&P 500 (for comparative purposes)
Red line: T2108 Overbought (70%); Blue line: T2108 Oversold (20%)
Weekly T2108
Be careful out there!
Disclosure: net short the Australian dollar; net long U.S. dollar; net short Japanese yen; long BABA; long EEM calls and puts