Get 40% Off
🎁 Free Gift Friday: Copy Legendary Investors' Portfolios in One ClickCopy for Free

S&P 500: Cyclical Low Hit At End Q1, Trend To Now Continue Higher

Published 07/03/2014, 12:15 AM
Updated 07/09/2023, 06:31 AM

Headed into this year, we looked for the one-way street in equities that had led the 2013 Meridian charge, to consolidate in traffic - as those markets, more impressionable to inflation expectations - or lack thereof - would emerge with the performance baton. Our general thinking at the time was, if you were going to be in equities longer-term, look to emerging markets and China, since we read the US dollar tea leaves as indicating the backside of strength and working towards a path of least resistance that eventually would lead to the bottom of its long-term range.

Accompanying the downside move in the dollar, we expected long-term yields to reverse lower from the relative extreme they notched at the close of last year. We estimated that this shift would be broadly bullish towards commodities and those currencies closely associated - and bearish on a relative performance basis towards the developed markets that have led and enjoyed the disinflationary - but rising yield environment over the past few years. 

Overall, our broader macro reads have been borne out with respect to inflation, yields and the dollar. Where we have been off the mark is anticipating where the SPX could stall and the topside range we expected at the start of the year that was closer to 1900 than 2000. That being said, while emerging markets and China still lag the relative performance trend of the SPX this year, we do maintain conviction that a cyclical low was reached for both (relative to the SPX) at the end of Q1 - and the balance of 2014 should provide a continuation of trend higher.

3rd party Ad. Not an offer or recommendation by Investing.com. See disclosure here or remove ads .

Moreover, as resilient as the SPX has been this year, the upside pivots in commodities and long-term Treasuries have still outperformed equities - which from our perspective foreshadows the broader sea change at hand. Despite what the pundits might package for sale in the headlines and sound bites, major shifts in the macro climate do not unfurl overnight.

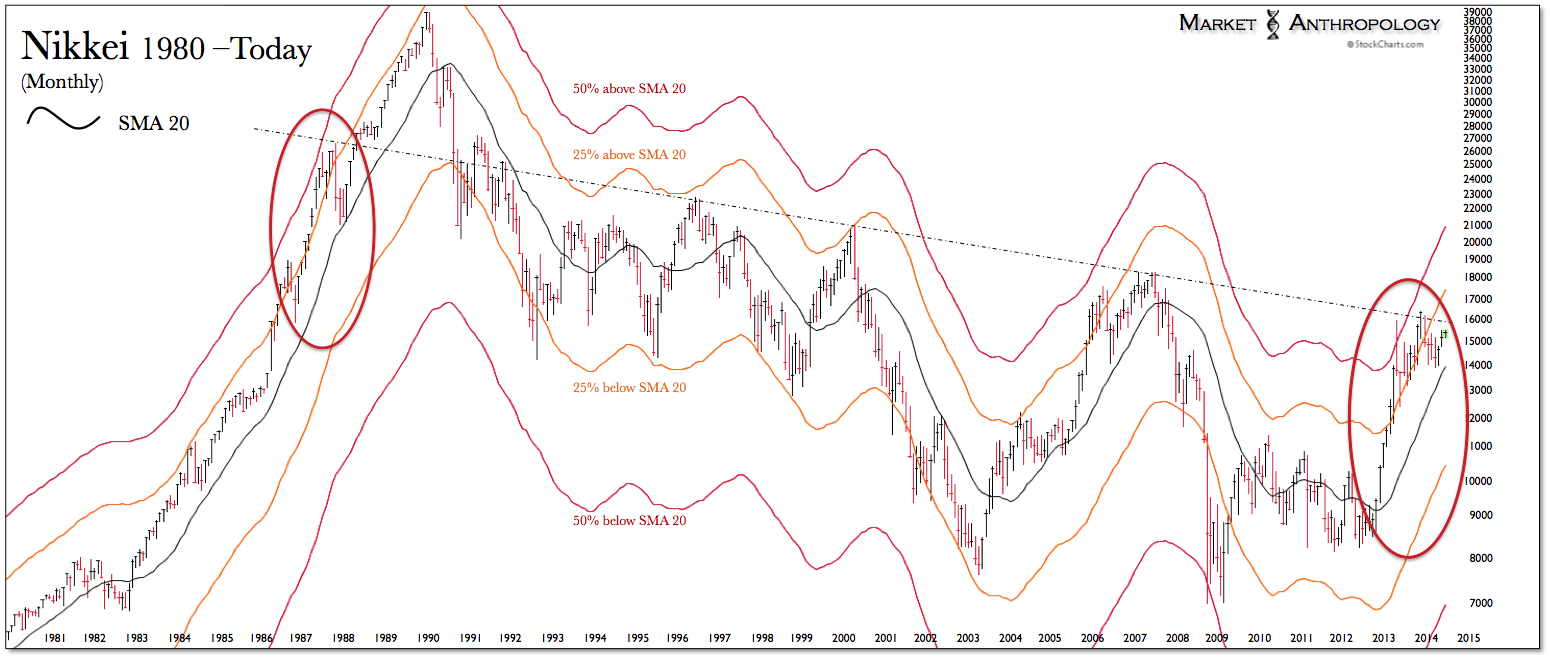
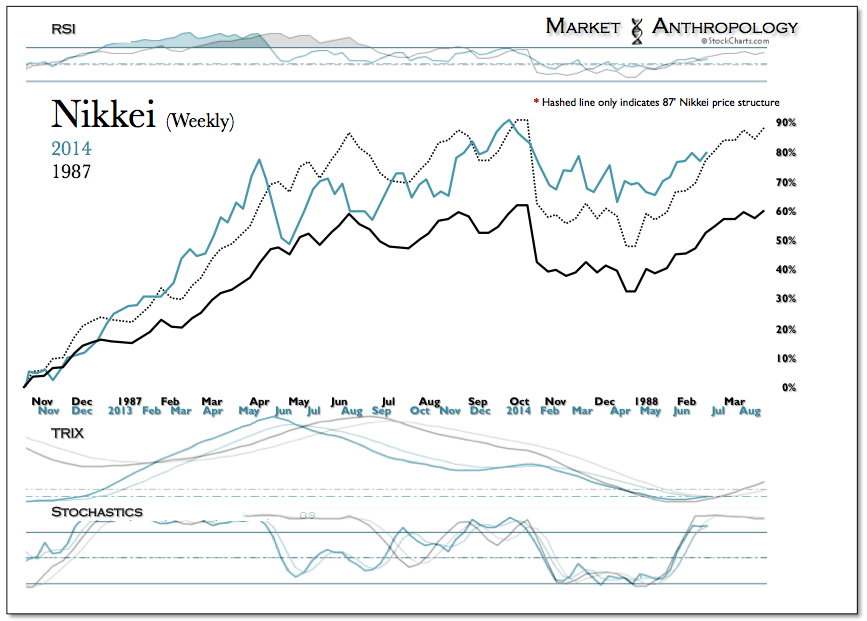
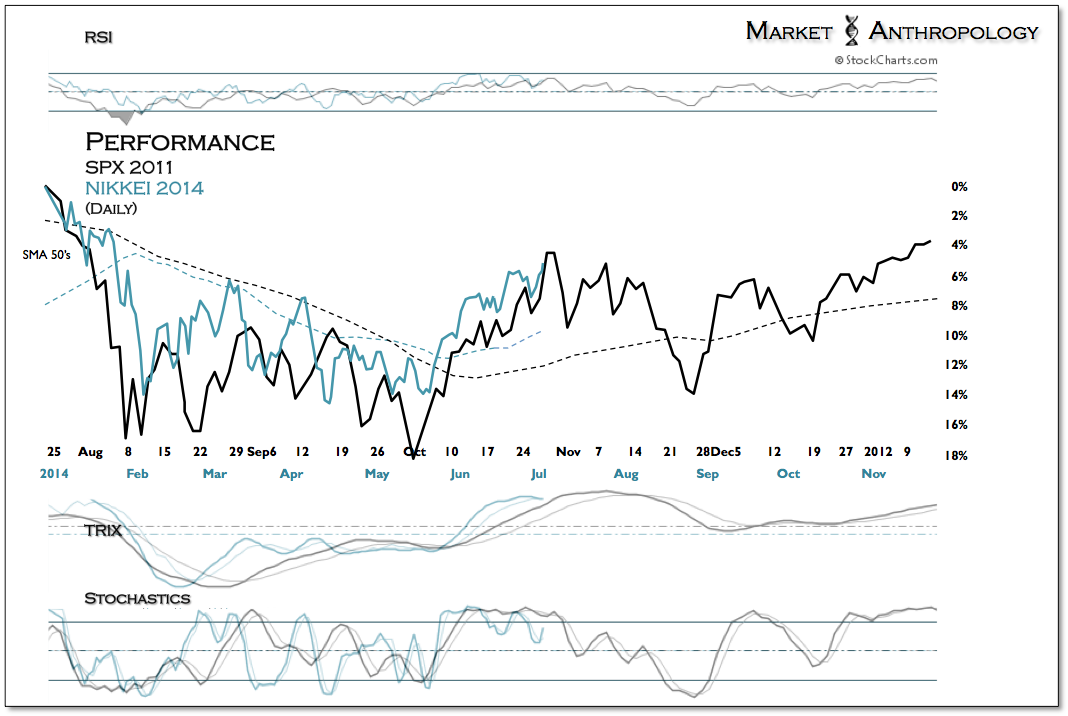
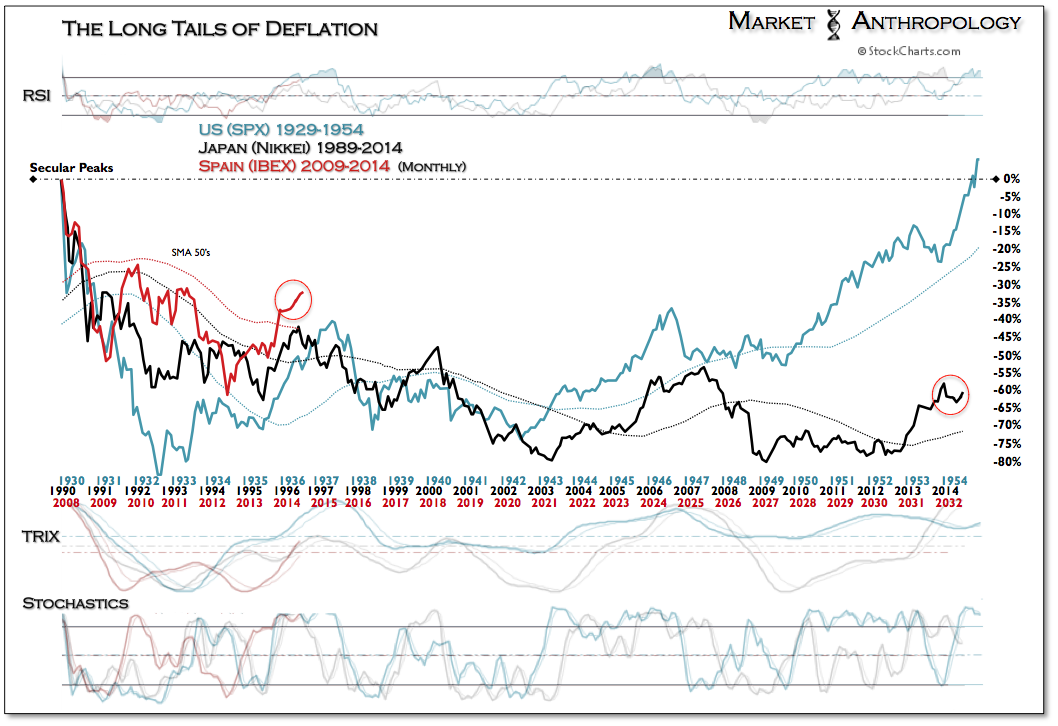
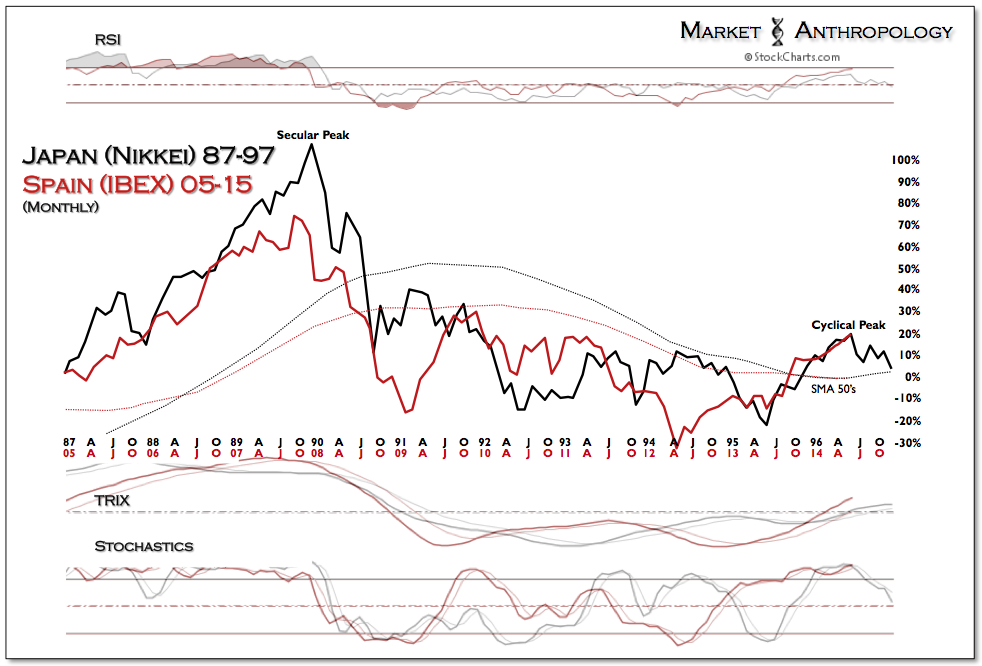
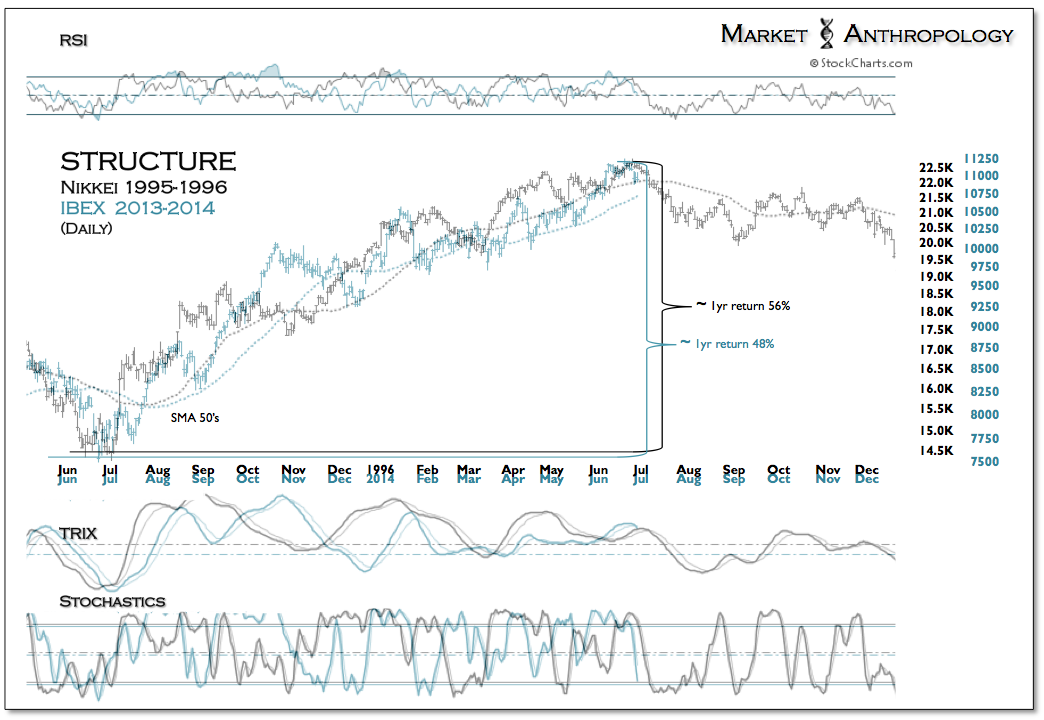
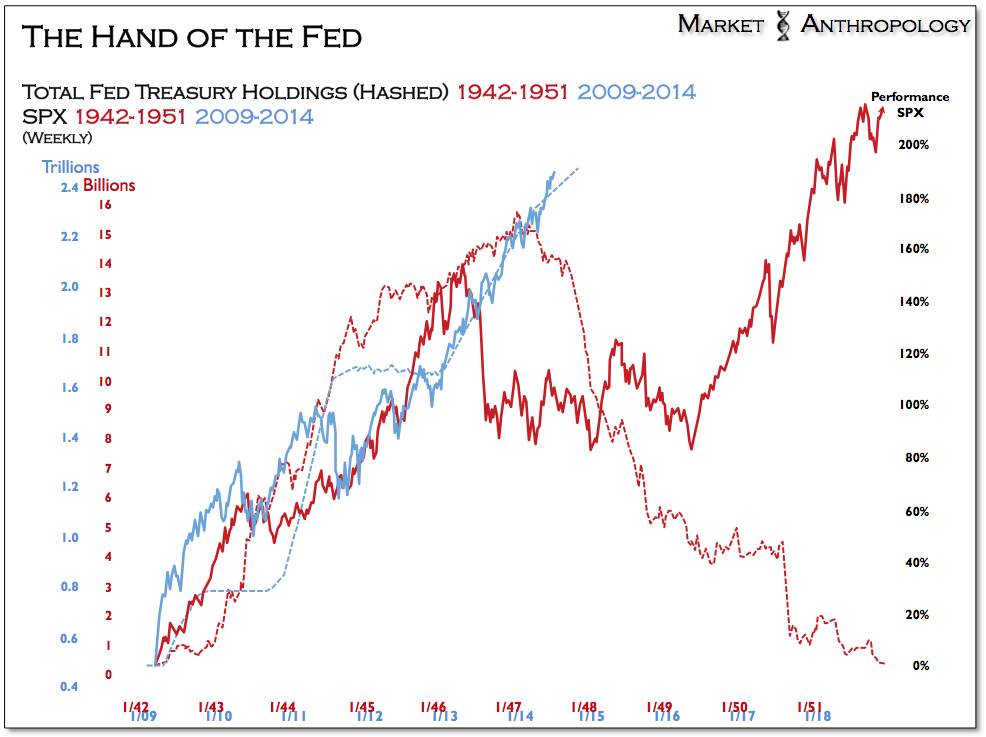
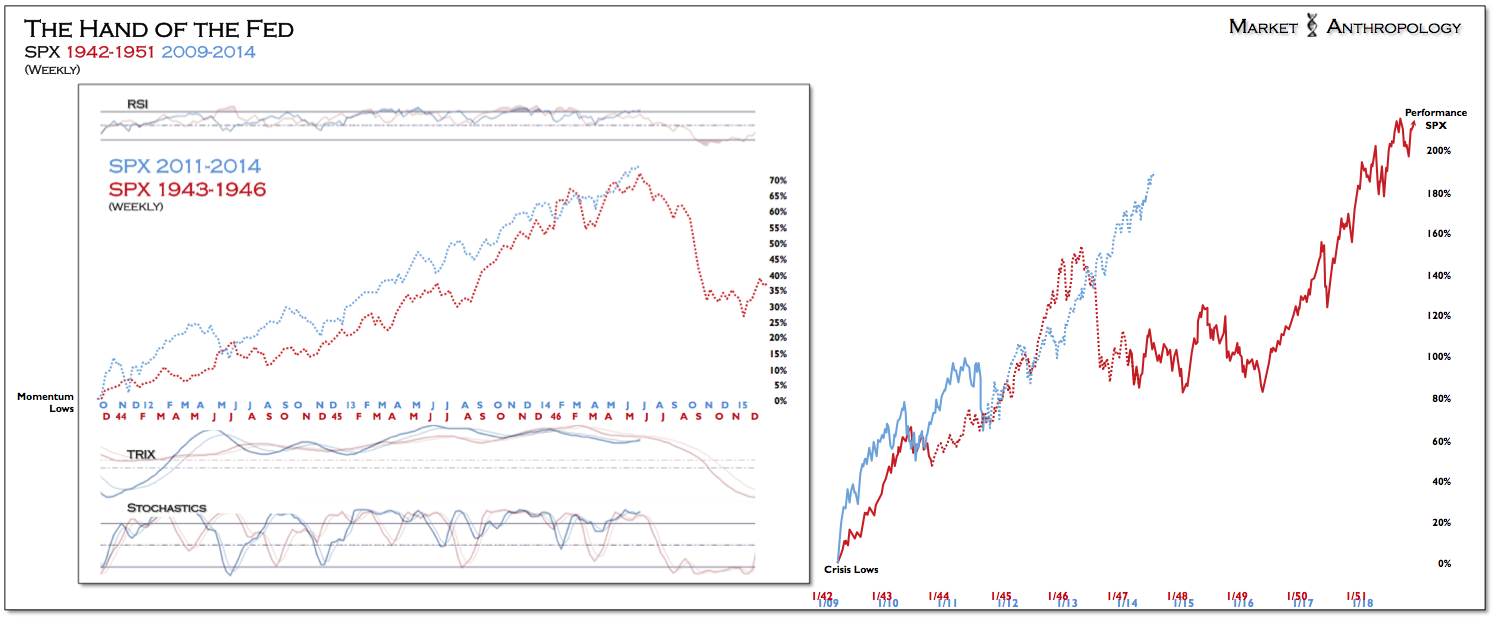
Rarely a simple read, our opinion on the developed equity market environment has recently bifurcated, as we see Japan finally looking to break free of the deflationary market conditions it has been trapped in over the past 25 years - while Spain gets caught up in similar tentacles. Although a material correction has yet to gather downside momentum, we still expect the tide to go out in the SPX as well - as it did in QE I (-16%) and QE II (-17%) as the Fed steps further away from extraordinary support. 

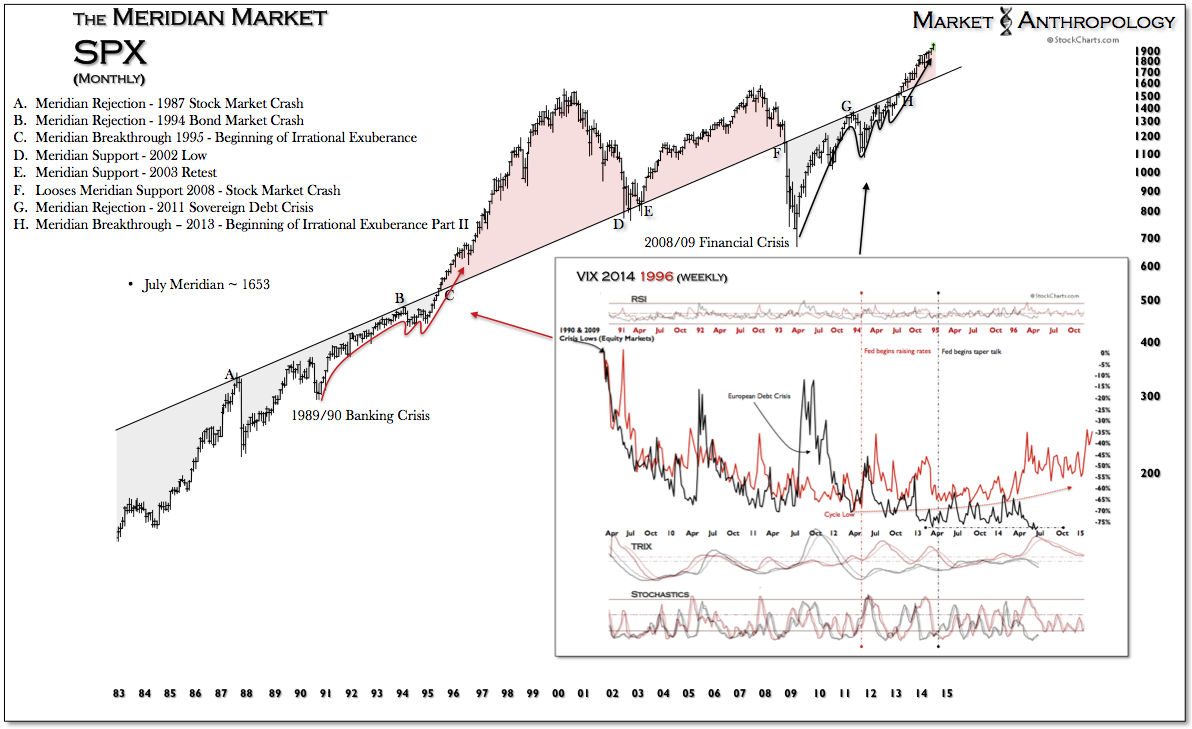
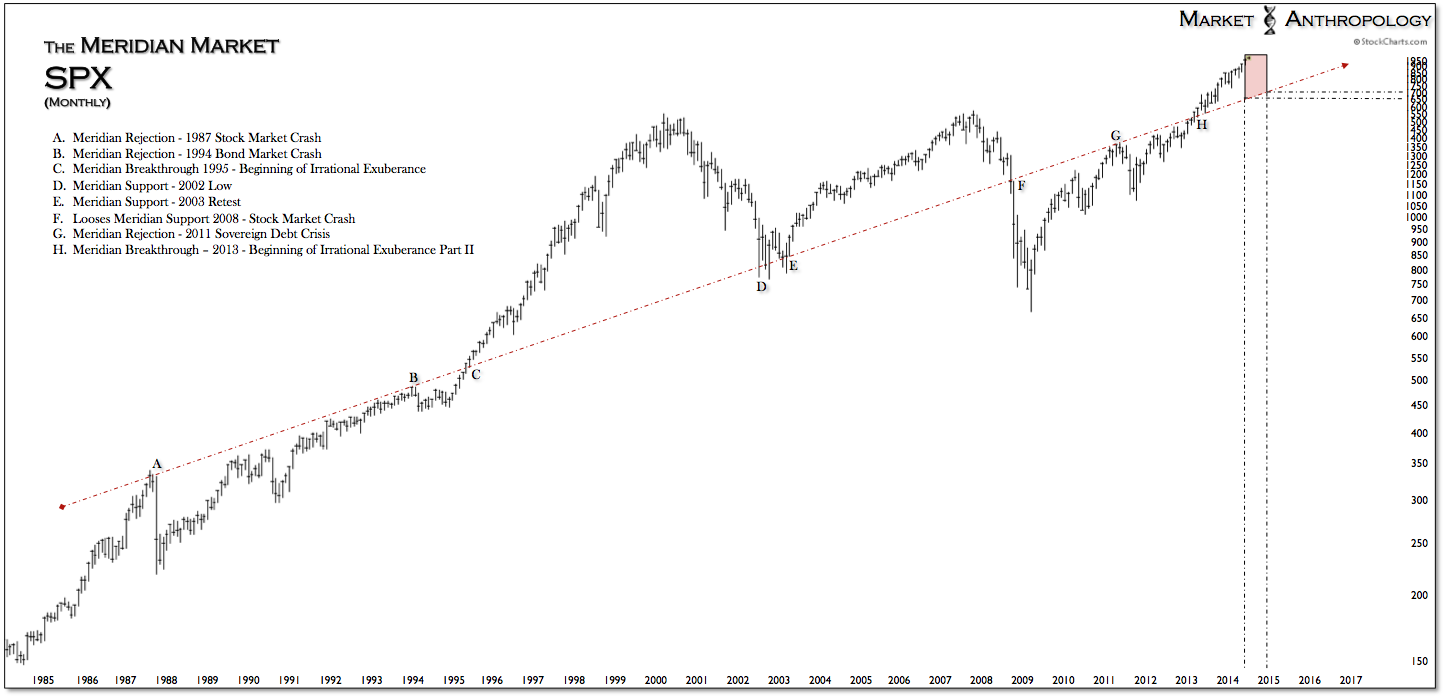
With this week's recent strength, the SPX has built a ~ 16% cushion above the monthly Meridian - which comes in ~ 1653 for July. Our best case scenario for the SPX is that the inevitable correction is confined by long-term support, as market expectations normalize in the wake of QE3.
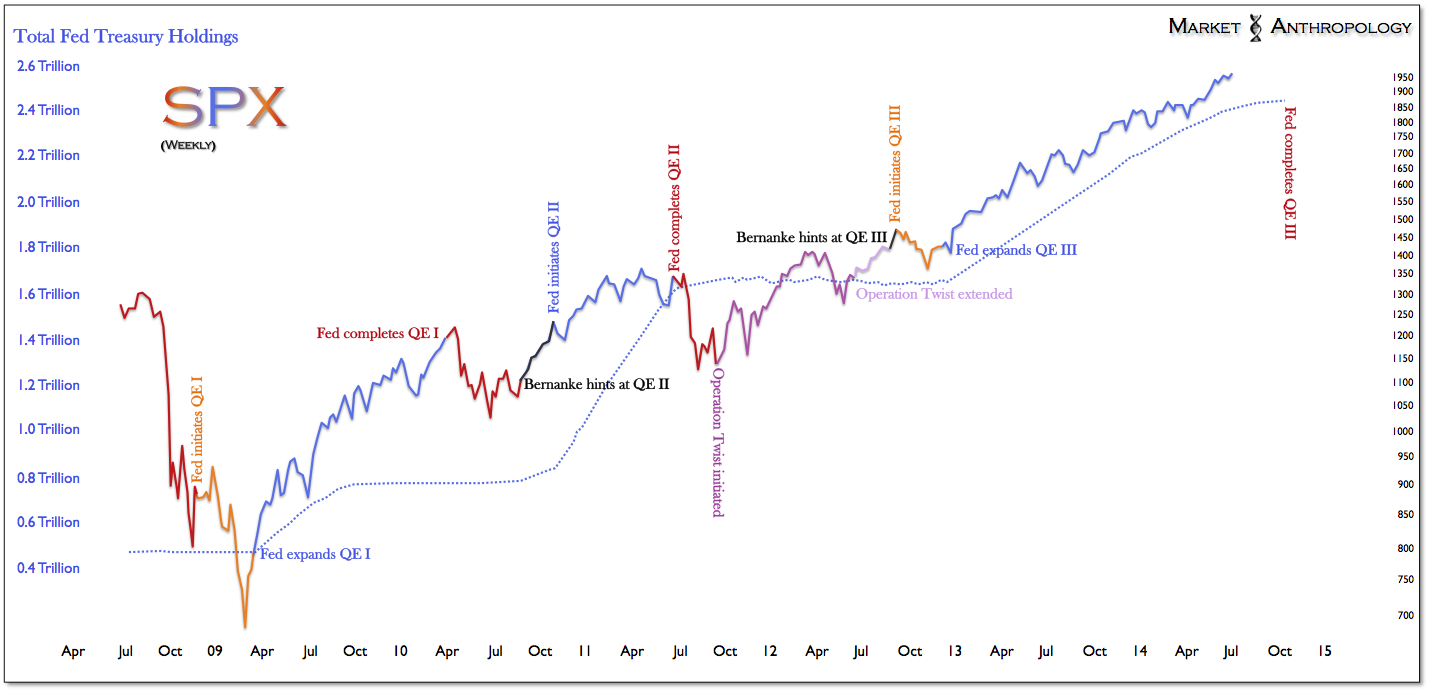
SPX Weekly vs Fed Holdings
SPX Monthly vs Meridian Market
Nikkei Monthly, 1980-Today
Nikkei Weekly 1987 vs 2014
SPX 2014 vs Nikkei 2014, Daily
The Long Tails of Deflation
Japan 1987-1997 vs Spain 2005-2015, Monthly
Nikkei 1995-1996 vs IBEX 2013-2014, Daily
The Hand of the Fed
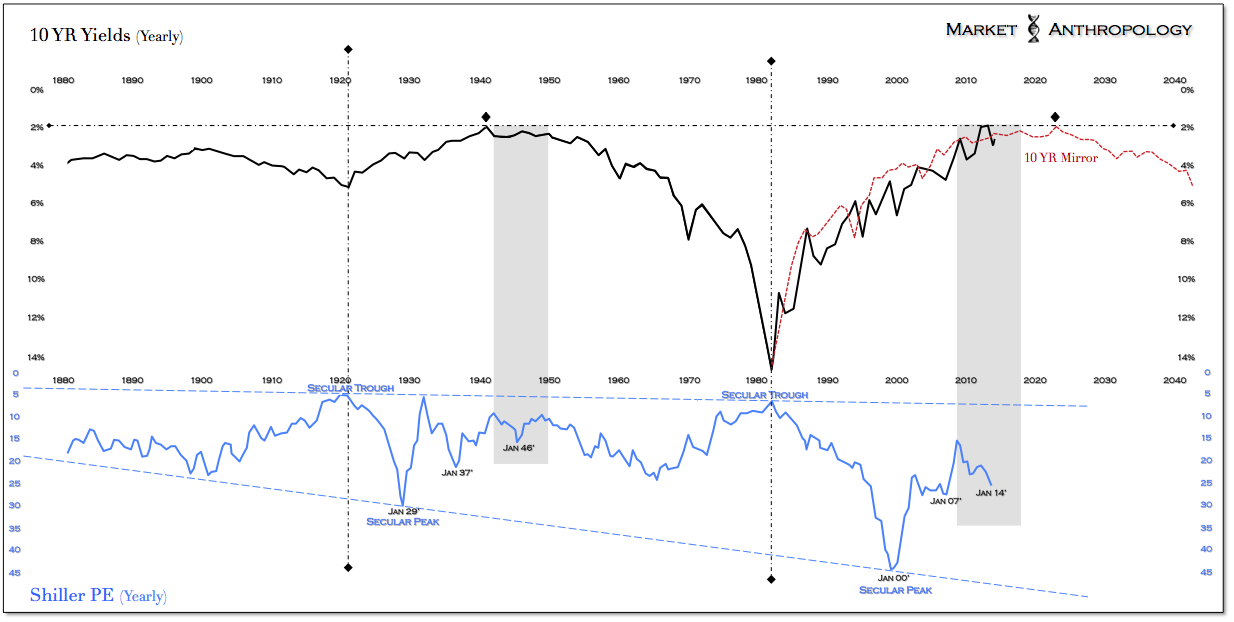
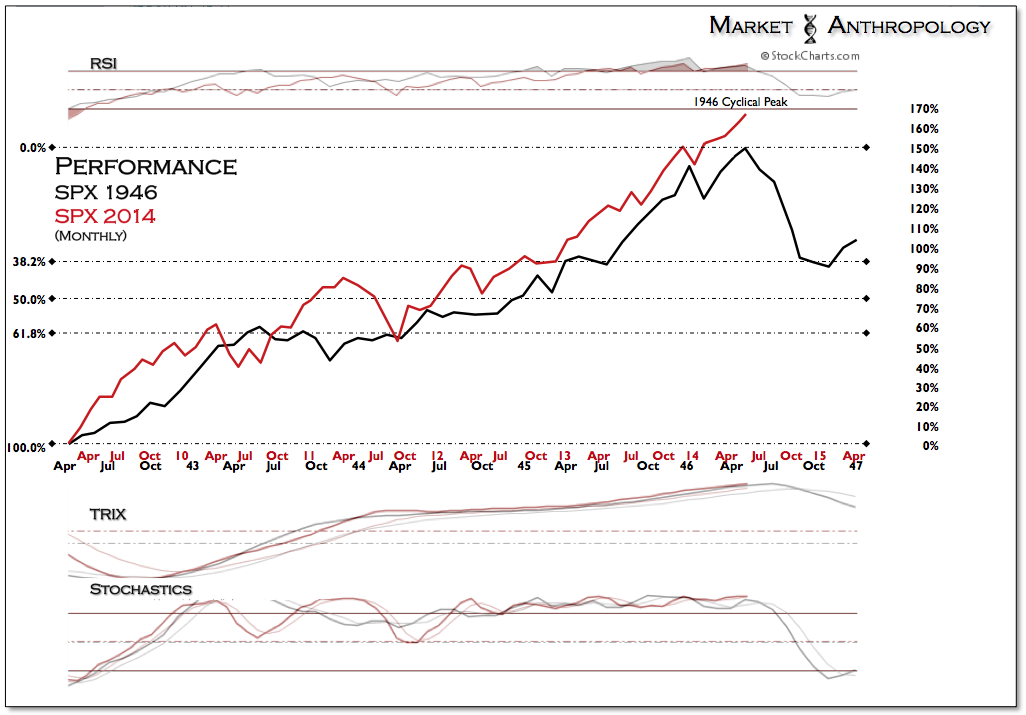
Hand of the Fed: SPX 1943-1946 vs SPX 2011-2014
10-Year Yields, Yearly
SPX 1946 vs SPX 2014 Monthly
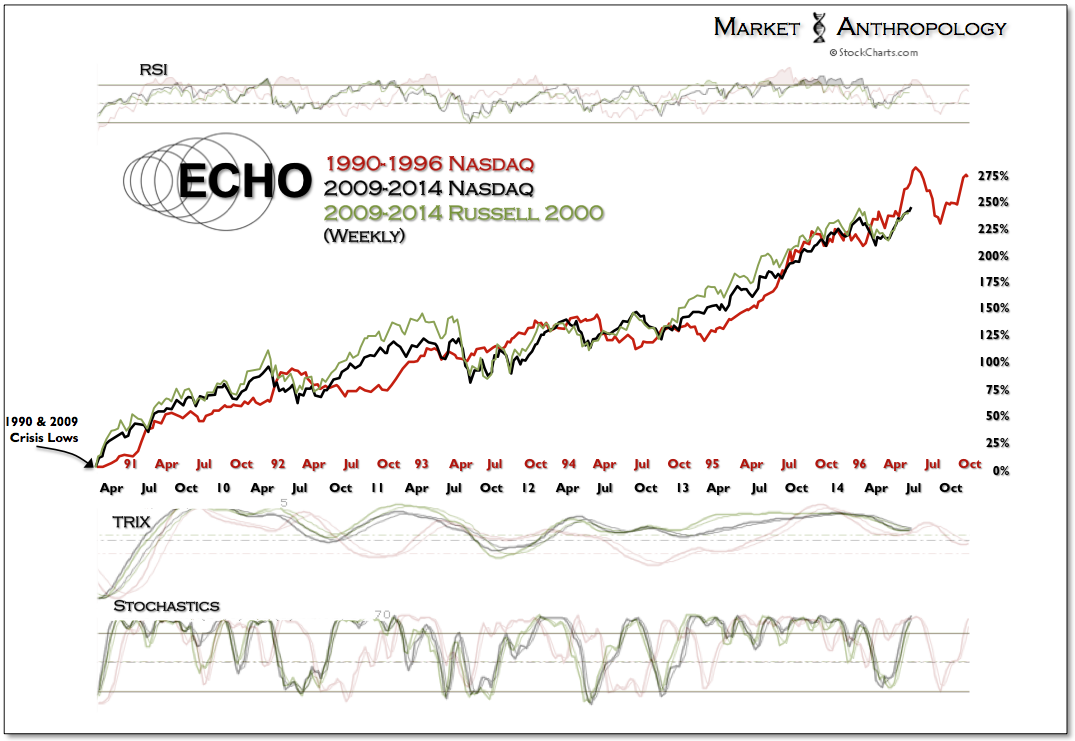
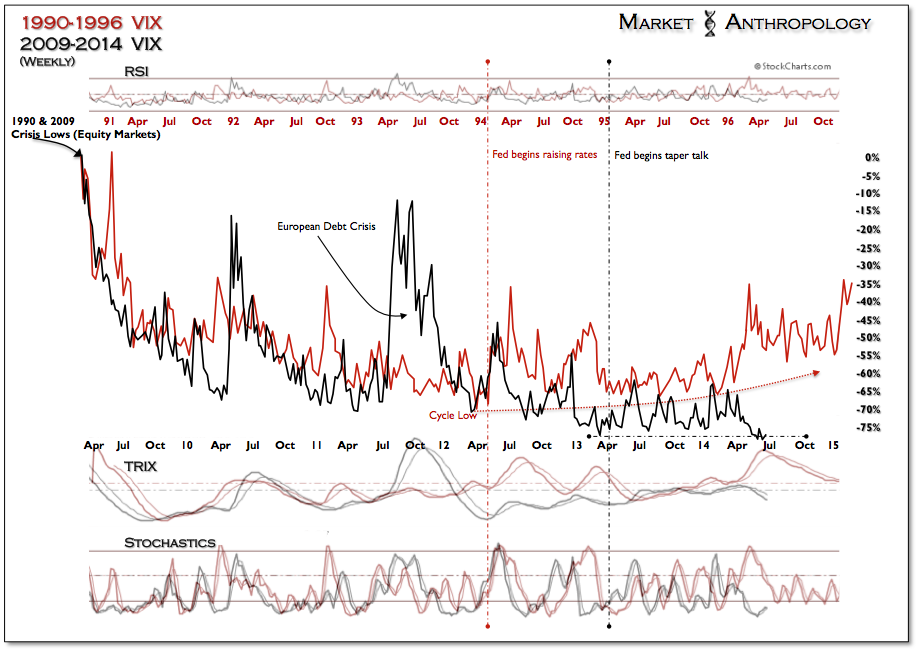
Taking a quick look at where the market stands in relation to the previous Meridian breakthrough in 1995. A wide divergence has recently appeared in the cycle as volatility has been squeezed out of the markets. 
 
What's interesting to note is the VIX pivoted lower almost directly where the 1990s irrational cycle took another stair higher in the range. Hindsight 20/20 - the rising VIX was actually a healthy expression of the wall-of-worry that the equity markets strongly climbed with during 1996 and for another three years afterward. From our perspective - and considering the market is fully cognizant of the nearing time horizon for the Fed ending QE - this does present a real irrational complacency in the markets.       
3rd party Ad. Not an offer or recommendation by Investing.com. See disclosure here or remove ads .
The Meridian Market: SPX Monthly


Nasdaq Weekly: 1990-1996 vs 2009-2014 vs RUT 2009-2014
VIX Weekly 1990-1996 vs 2009-2014
 
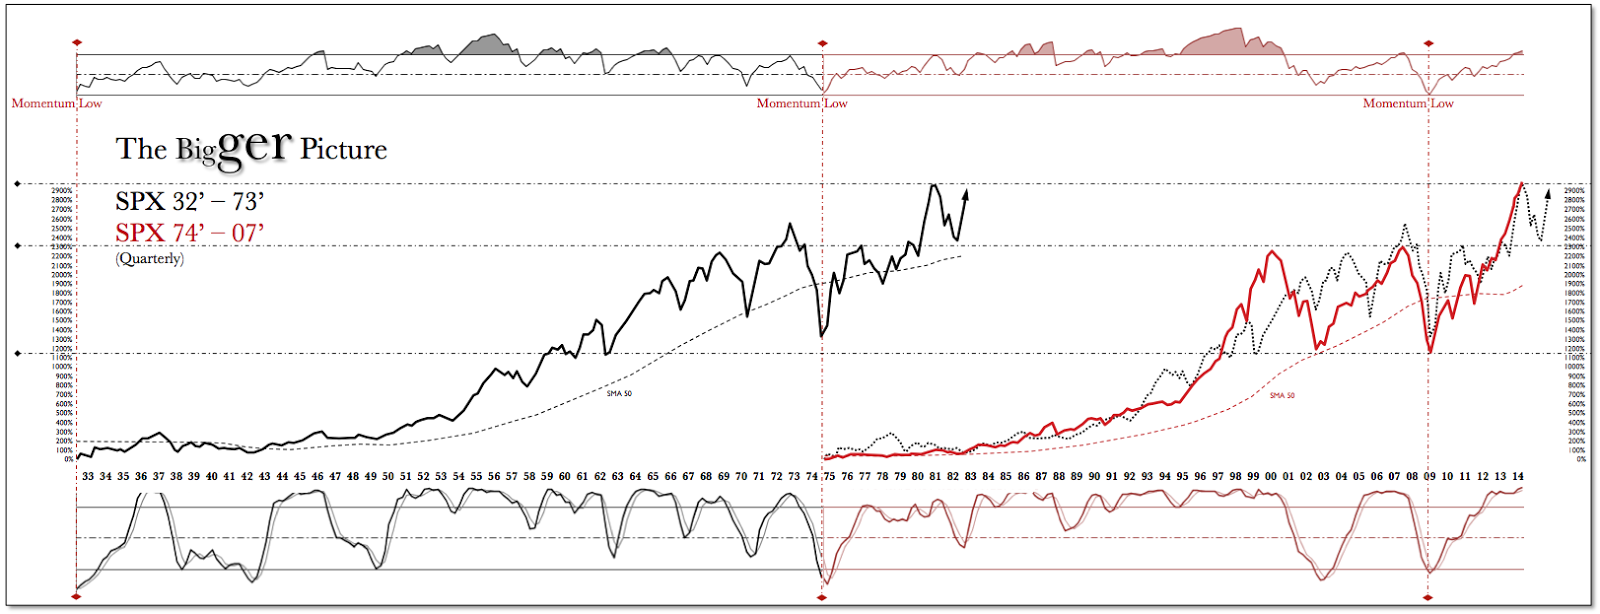
Last December we worked up a very long-term performance study that was defined by the major momentum RSI lows over the past 80 years. The study primarily encompassed two long-term cycles (as defined by the RSI lows) and the recovery rally that extended from the momentum extreme. With the recent run-up in the SPX, the current recovery rally has now marginally exceeded the proportion that marked the cyclical peak in 1980. 
The Bigger Picture

Latest comments

Risk Disclosure: Trading in financial instruments and/or cryptocurrencies involves high risks including the risk of losing some, or all, of your investment amount, and may not be suitable for all investors. Prices of cryptocurrencies are extremely volatile and may be affected by external factors such as financial, regulatory or political events. Trading on margin increases the financial risks.
Before deciding to trade in financial instrument or cryptocurrencies you should be fully informed of the risks and costs associated with trading the financial markets, carefully consider your investment objectives, level of experience, and risk appetite, and seek professional advice where needed.
Fusion Media would like to remind you that the data contained in this website is not necessarily real-time nor accurate. The data and prices on the website are not necessarily provided by any market or exchange, but may be provided by market makers, and so prices may not be accurate and may differ from the actual price at any given market, meaning prices are indicative and not appropriate for trading purposes. Fusion Media and any provider of the data contained in this website will not accept liability for any loss or damage as a result of your trading, or your reliance on the information contained within this website.
It is prohibited to use, store, reproduce, display, modify, transmit or distribute the data contained in this website without the explicit prior written permission of Fusion Media and/or the data provider. All intellectual property rights are reserved by the providers and/or the exchange providing the data contained in this website.
Fusion Media may be compensated by the advertisers that appear on the website, based on your interaction with the advertisements or advertisers.
© 2007-2024 - Fusion Media Limited. All Rights Reserved.