Get 40% Off
👀 👁 🧿 All eyes on Biogen, up +4,56% after posting earnings. Our AI picked it in March 2024.
Which stocks will surge next?
Unlock AI-picked Stocks

S&P 500: Can We Expect Some Outperformance?

Published 03/01/2015, 05:24 AM
Updated 07/09/2023, 06:31 AM

The S&P 500 index underperformed most of the major indices last week, as shown in the graph below. It has also underperformed since the beginning of the year -
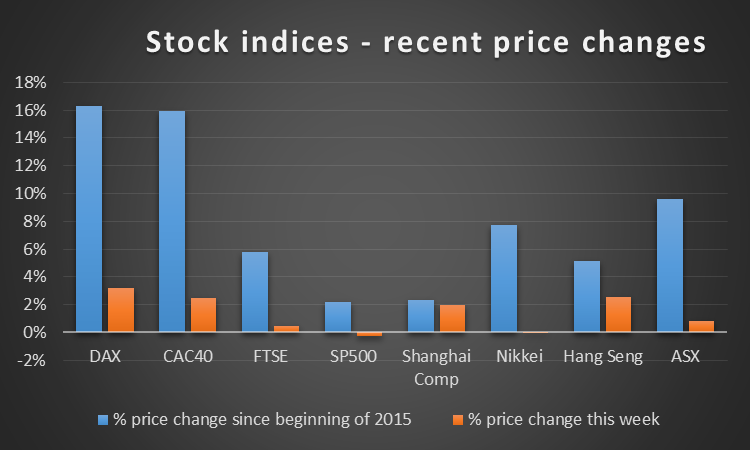
Global Indices Recent Changes

Largely as a result of the firming in other stock indices and the 13 basis point drop in the 30 year bond rate, the fair value of the S&P 500 increased over the week. The graph below analyzes the fair value increase in more detail -
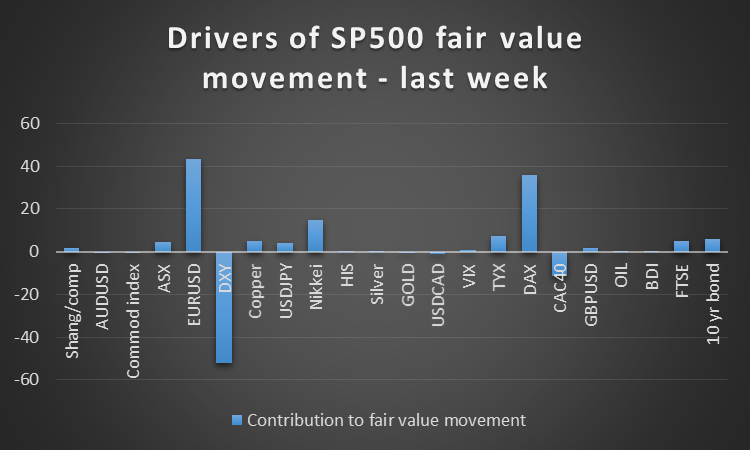
S&P 500 Fair Value Drivers

The increase in the S&P’s fair value occurred alongside a weakening in the index - such a disparity would normally be a signal to buy the S&P short term. Taking positions based on disparities between fair value and price change of the S&P 500 index over the last 90 days would have yielded a small annualized gain, of 3.2%, with volatility of 14%.

This tentative buy signal is reinforced by our assessment that the S&P is undervalued on fundamentals - we have its fair value at 4% below the current price. Taking positions based on this signal of under/over valuation would have generated an annualized return of 8% with volatility of 14% over the last 90 days.

Further support for the outperform view is given by our signal based on the lead given by the change in the Baltic Dry Index (BDI) of raw material shipping freight rates. This index is widely seen as a leading indicator of world economic growth, with increases viewed as bullish and conversely. Based on the relationship between movements in the BDI and S&P 500 index over the last six years, the 11% drop in the BDI over the last month bodes for a short term increase in the S&P.

3rd party Ad. Not an offer or recommendation by Investing.com. See disclosure here or remove ads .

Trading this signal would have yielded a 9.2% annualized gain with volatility of 15% over the last six years.

What to watch for

The graph below shows the sensitivity of the S&P’s fair value to various drivers –
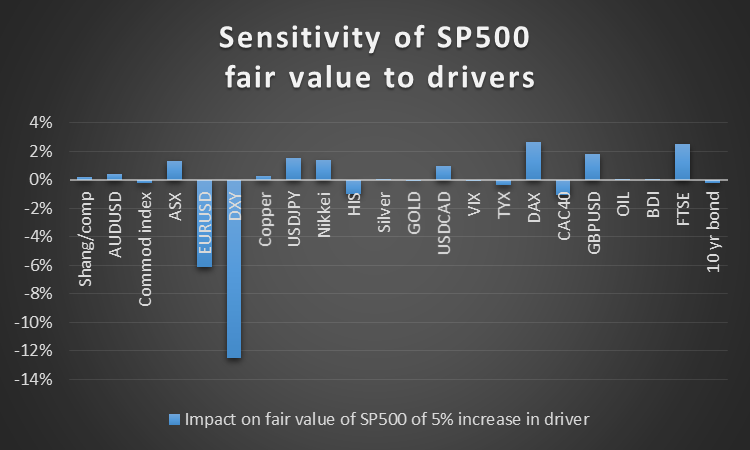
S&P 500 Sensitivity

The graph highlights the index’s sensitivity to USD currency pair exchange rates. These could undergo some volatility this week with the release of the PMIs and jobs data, which could translate into some volatility in the S&P. However, looking back over the last three years, the volatility of changes in the S&P 500 index for the week leading up to the non farm payrolls print has been no greater than for all weeks.

Latest comments

Risk Disclosure: Trading in financial instruments and/or cryptocurrencies involves high risks including the risk of losing some, or all, of your investment amount, and may not be suitable for all investors. Prices of cryptocurrencies are extremely volatile and may be affected by external factors such as financial, regulatory or political events. Trading on margin increases the financial risks.
Before deciding to trade in financial instrument or cryptocurrencies you should be fully informed of the risks and costs associated with trading the financial markets, carefully consider your investment objectives, level of experience, and risk appetite, and seek professional advice where needed.
Fusion Media would like to remind you that the data contained in this website is not necessarily real-time nor accurate. The data and prices on the website are not necessarily provided by any market or exchange, but may be provided by market makers, and so prices may not be accurate and may differ from the actual price at any given market, meaning prices are indicative and not appropriate for trading purposes. Fusion Media and any provider of the data contained in this website will not accept liability for any loss or damage as a result of your trading, or your reliance on the information contained within this website.
It is prohibited to use, store, reproduce, display, modify, transmit or distribute the data contained in this website without the explicit prior written permission of Fusion Media and/or the data provider. All intellectual property rights are reserved by the providers and/or the exchange providing the data contained in this website.
Fusion Media may be compensated by the advertisers that appear on the website, based on your interaction with the advertisements or advertisers.
© 2007-2024 - Fusion Media Limited. All Rights Reserved.