
: 21.9% (intraday low of 18.0%)
VIX Status: 18.9 (failed at resistance from level that launched summer swoon in 2011)
General (Short-term) Trading Call: Hold (only buy after oversold readings)
Active T2108 periods: Day #2 under 30% (underperiod), Day #3 under 40%; Day #21 under 70% (underperiod)
Commentary
Although the T2108 Trading Model (TTM) nailed yet another 1-day prediction, Friday’s bounce from oversold conditions was relatively weak and unconvincing. The trading was exactly what I did NOT want to see. The S&P 500 (SPY) did not open and gap down to deeply oversold conditions. The index did not surge to reverse the previous day’s losses.
Instead, the index put on a middling performance: trading meekly up, sliding to a small loss, and then bouncing shortly after the index hit oversold again. Having the intraday data on T2108 continues to be a valuable tool. Thanks to seeing that data, and making the observation in the land of foreign exchange that there were no big moves consistent with an intraday sell-off, I was able to accurately call a bottom in the action (posted on twitter in real-time). I did not trade the bottom because I was waiting for the SSO calls to get slightly cheaper.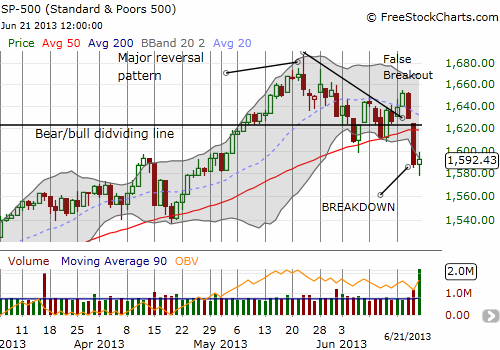
In the following chart, I show how I used the Australian dollar versus the U.S. dollar (AUD/USD) to guess at an intraday bottom in the S&P 500. Knowing T2108 was oversold firmed my conviction. (AUD/USD is shown in candlesticks, the S&P 500 is in a solid, black line).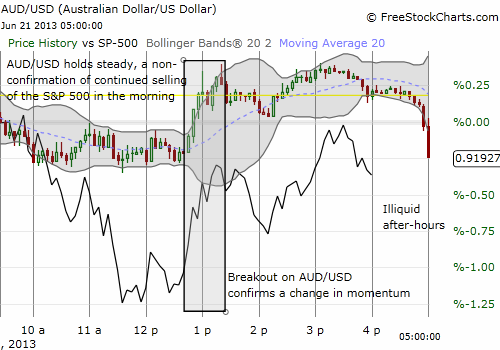
What makes this bounce particularly weak is that the index could not hold the nice rally from the lows to close at or near the highs. Also note how the index closed directly BELOW the lower-Bollinger Band (BB). This indicates that sellers still hold sway. Given Mondays tend to be down days, I am expecting selling to resume come Monday and provide a fresh oversold opportunity. I am going to get more picky for the next tranche of SSO calls. I will only pull the next trigger once/if T2108 hits 15% or lower. I am setting this threshold to avoid buying more calls before a washout-like event occurs.
Finally, two quick trading updates. Firstly, I clearly sold out of my Apple (AAPL) puts too early. AAPL’s plunge continued below $410 on increasing daily selling volume. Sticking to the Apple Trading Model (ATM), I added to my call option in anticipation of a good Monday and hopefully Tuesday, but I fear the odds are against it this time given my expectation for a weak S&P 500.
Secondly, a quick follow-up on my piece describing the breakout on Baidu (BIDU). Since then, BIDU sure enough gave up the bullish move within two days. After giving up its desperate cling to its 200DMA, BIDU is now retesting 50DMA support. I like the chart only because the 50DMA is sloping upward and the day ended on a “doji” showing a dissipation of selling pressure. Moreover, unlike the last false breakout, selling volume has not surged to an extremely high level. If the market somehow cooperates next week, BIDU could quickly rally back to 100, directly above the 200DMA. I expect the general stock market will need to stage an on-going rally to assist BIDU to rally past the high from the previous breakout. 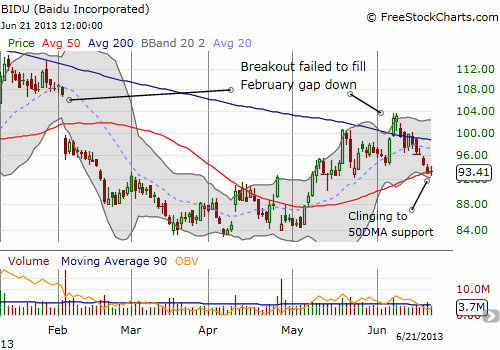
Daily T2108 vs the S&P 500
Black line: T2108 (measured on the right); Green line: S&P 500 (for comparative purposes) Red line: T2108 Overbought (70%); Blue line: T2108 Oversold (20%)
Be careful out there!
Disclosure: long SSO calls, long AAPL shares and calls, net long Australian dollar, long BIDU calls
- English (UK)
- English (India)
- English (Canada)
- English (Australia)
- English (South Africa)
- English (Philippines)
- English (Nigeria)
- Deutsch
- Español (España)
- Español (México)
- Français
- Italiano
- Nederlands
- Português (Portugal)
- Polski
- Português (Brasil)
- Русский
- Türkçe
- العربية
- Ελληνικά
- Svenska
- Suomi
- עברית
- 日本語
- 한국어
- 简体中文
- 繁體中文
- Bahasa Indonesia
- Bahasa Melayu
- ไทย
- Tiếng Việt
- हिंदी
S&P 500: A Weak And Unconvincing Bounce
Published 06/23/2013, 02:55 AM
Updated 07/09/2023, 06:31 AM
S&P 500: A Weak And Unconvincing Bounce
T2108 Status
3rd party Ad. Not an offer or recommendation by Investing.com. See disclosure here or
remove ads
.
Latest comments
Install Our App
Risk Disclosure: Trading in financial instruments and/or cryptocurrencies involves high risks including the risk of losing some, or all, of your investment amount, and may not be suitable for all investors. Prices of cryptocurrencies are extremely volatile and may be affected by external factors such as financial, regulatory or political events. Trading on margin increases the financial risks.
Before deciding to trade in financial instrument or cryptocurrencies you should be fully informed of the risks and costs associated with trading the financial markets, carefully consider your investment objectives, level of experience, and risk appetite, and seek professional advice where needed.
Fusion Media would like to remind you that the data contained in this website is not necessarily real-time nor accurate. The data and prices on the website are not necessarily provided by any market or exchange, but may be provided by market makers, and so prices may not be accurate and may differ from the actual price at any given market, meaning prices are indicative and not appropriate for trading purposes. Fusion Media and any provider of the data contained in this website will not accept liability for any loss or damage as a result of your trading, or your reliance on the information contained within this website.
It is prohibited to use, store, reproduce, display, modify, transmit or distribute the data contained in this website without the explicit prior written permission of Fusion Media and/or the data provider. All intellectual property rights are reserved by the providers and/or the exchange providing the data contained in this website.
Fusion Media may be compensated by the advertisers that appear on the website, based on your interaction with the advertisements or advertisers.
© 2007-2024 - Fusion Media Limited. All Rights Reserved.