S&P 500 (cash) near term outlook:
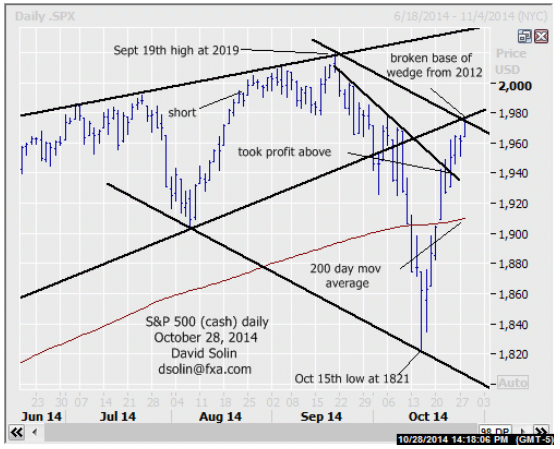
S&P 500 is firm near recent highs and building on the large bounce from the Oct 15th low at 1821. No doubt the market is near term overbought and testing important resistance in the 1975/85 area, both the broken base of the large rising wedge that had been forming since Nov 2012 (retests common before resuming the larger trend), as well as the ceiling of the bearish channel since Aug (see daily chart below). Also don't forget that time cycles point lower into late Nov (previously discussed "Bradley Model"). At this point, there is no confirmation of even a shorter term top "pattern-wise" (5 waves down on shorter term chart for example), but this is "ideal" area to form a top for at least a few weeks. Further resistance above 1975/85 is seen at the Sept 2015/20 high, support is seen at the widely watched 200 day moving average (currently at 1905/10). Bottom line : within "ideal" area to form a top for least a few weeks, but no confirmation so far.
Near term strategy/position:
Took profit in the Aug 21st sell at 1990 on the large snapback above the bear trendline from the high on Oct 23rd (1940, closed at 1951). At this point with the market in an "ideal" area to form a top, would resell here (currently at 1976). Initially stop on a close above 1990 to allow for further, nearby topping but quickly getting more aggressive on declines, as the action may remain volatile ahead. Though there is still no confirmation of a top (and thus somewhat lower confidence), the limited risk still makes for a good overall risk/reward in the position.
Long term outlook:
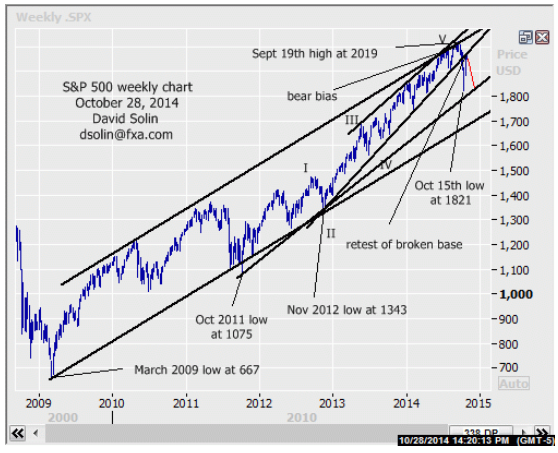
No change, as a more major top (for at least 9-12 months) is still seen potentially in place. As discussed above, the market is currently retesting that broken base of the rising wedge from 2012, a common occurrence before resuming the larger decline (down in this case). Additionally, other longer term negatives remain and include the likely completion of the whole, 5 wave rally from the Oct 2011 low at 1075 (wave V), and a still overbought market after the sharp gains from the March 2009 low at 667. This in turn argues decline back to that 1810/20 support area (Oct 15th spike low and the bullish trendline from Oct 2011, see in red on weekly chart/2nd chart below) and potentially below. At this point, the shape of this longer term downside (if it does indeed occur) is a question (more substantial declines or extended period of broad ranging). But in any case, substantial big picture gains from here are not favored (any further upside and even new highs would be seen as part of a longer term topping). Further long term support below that 1810/20 area is seen at he more major, 1655/75 support area (both the base of the bullish channel from Mar 2009 and a 38% retracement from the Oct 2011 low at 1075). Bottom line : more major top seen likely place (at least another 9-12 months), but shape/downside magnitude a question.
Long term strategy/position:
With a more topping seen, would stay with the longer term bearish bias that was put in place on Aug 21st at 1990.
Current:
Nearer term : resold Oct 28th at 1976, "ideal" area to top though no confirmation so far.
Last : short Aug 21 at 1990, took profit Oct 23 above t-line from highs (1940, closed 1951, 39 pts).
Longer term: bearish bias Aug 21st at 1990, more major top seen in place.


