Get 40% Off
🚨 Volatile Markets? Find Hidden Gems for Serious Outperformance
Find Stocks Now

S&P 500 Snapshot: A Post-Brexit Bounce

Published 06/29/2016, 12:24 AM
Updated 07/09/2023, 06:31 AM

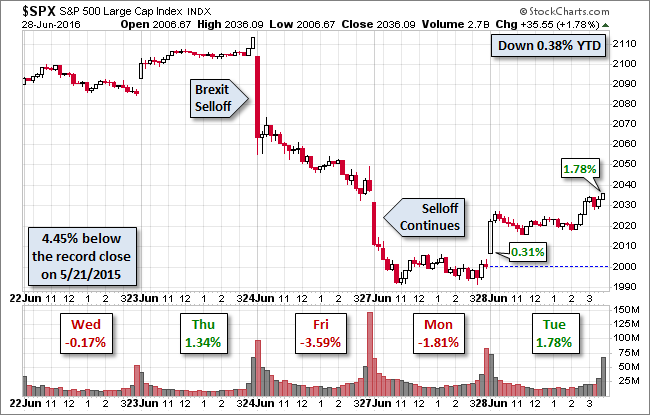
The global post-Brexit selloff reversed itself today. Most Asia-Pacific indexes were modestly higher, and major European indexes saw major bounces. The FTSE rose 2.64%, the CAC 2.61% and the DAX 1.93%. The rally spilled over to US equities. Our benchmark S&P 500 opened at its 0.31% intraday low and spent much of the day in a narrow range just north of +1%. A second wave of buying in the final 90 minutes lifted the index to its close spot on its intraday 1.78% high. Can the rally continue? Stay tuned!

Treasuries, however, showed now reversal. The 10-year note closed at 1.46%, unchanged from the previous session. That's a mere 3 BPs above its all-time closing low of 1.43%.

Here is a snapshot of past five sessions in the S&P 500.
S&P 500 Chart

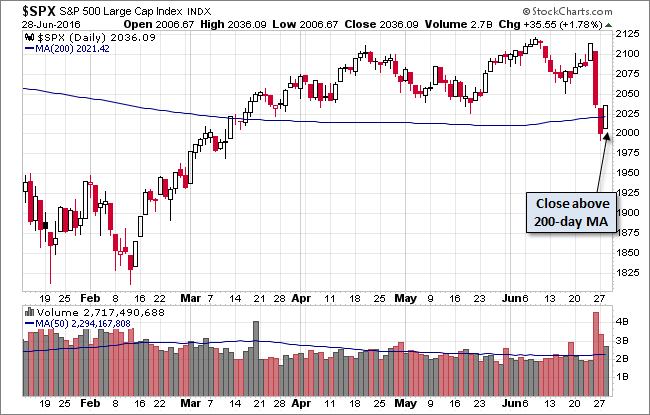
Here is a daily chart. The index spent most of the session stuck at its 200-day moving average. But that rally in the final 90 minutes lifted it above that technical benchmark.
SPX Daily Chart

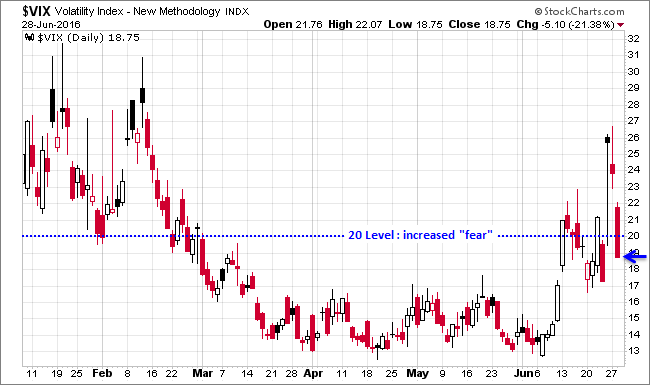
Here's a look at the VIX volatility index, the celebrated "fear gauge" market indicator. Today's selloff continued well above the 20 benchmark.
VIX Daily Chart

A Perspective on Drawdowns

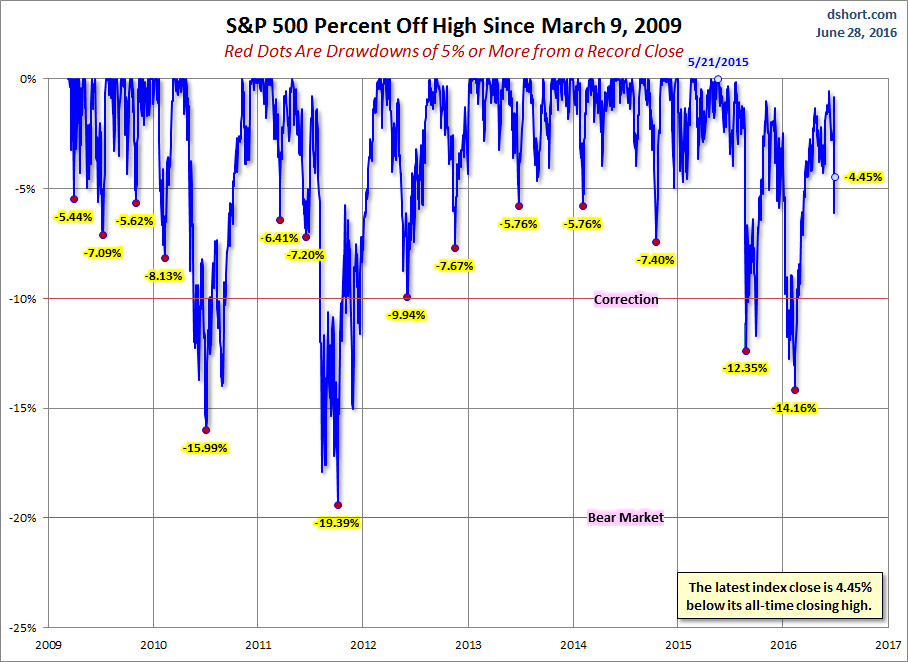
Here's a snapshot of selloffs since the 2009 trough.
S&P 500 Percent Off High Since March 9, 2009

Here is a more conventional log-scale chart with drawdowns highlighted.
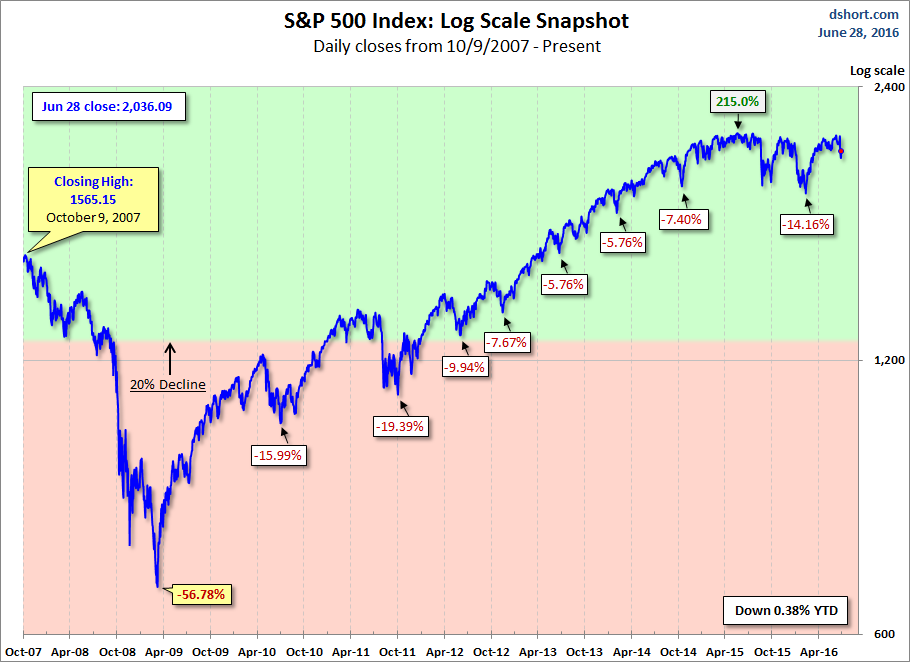
S&P 500 Index Log Scale Snapshot

Here is a linear scale version of the same chart with the 50- and 200-day moving averages.
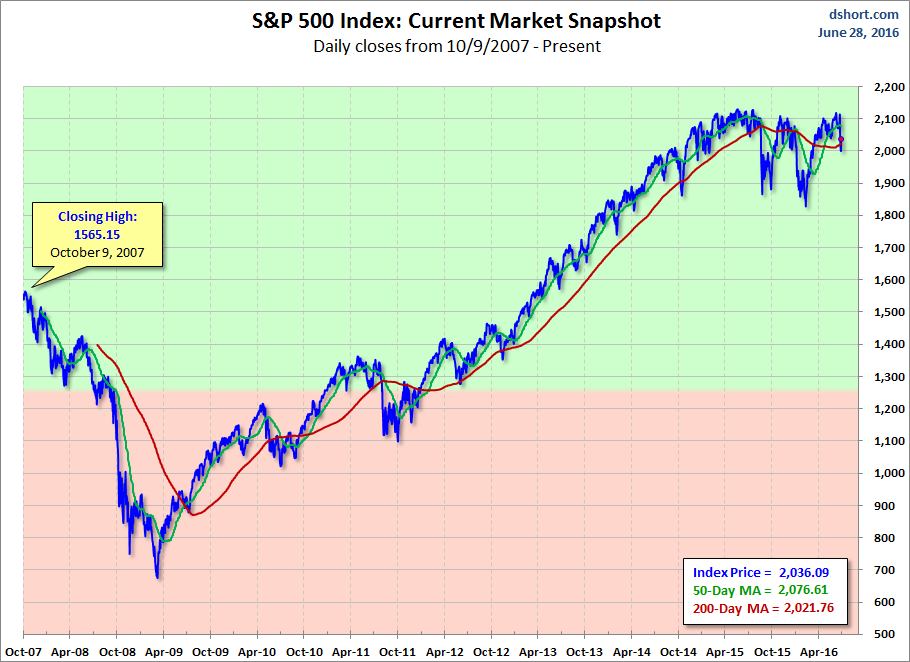
S&P 500 Index Current Market Snapshot

A Perspective on Volatility

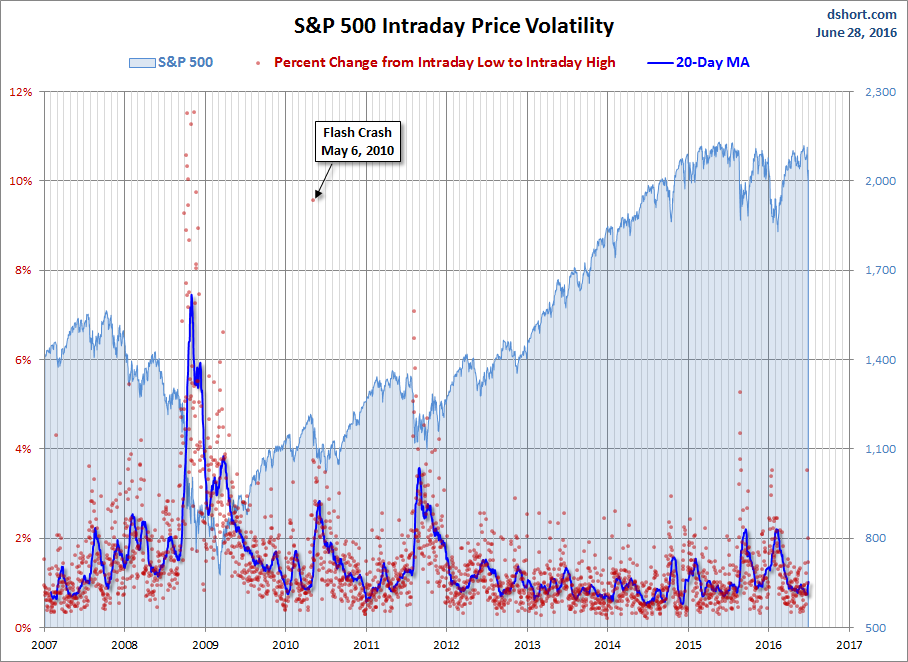
For a sense of the correlation between the closing price and intraday volatility, the chart below overlays the S&P 500 since 2007 with the intraday price range. We've also included a 20-day moving average to help identify trends in volatility.
3rd party Ad. Not an offer or recommendation by Investing.com. See disclosure here or remove ads .

S&P 500 Snapshot Intraday Price Volatility

Latest comments

Risk Disclosure: Trading in financial instruments and/or cryptocurrencies involves high risks including the risk of losing some, or all, of your investment amount, and may not be suitable for all investors. Prices of cryptocurrencies are extremely volatile and may be affected by external factors such as financial, regulatory or political events. Trading on margin increases the financial risks.
Before deciding to trade in financial instrument or cryptocurrencies you should be fully informed of the risks and costs associated with trading the financial markets, carefully consider your investment objectives, level of experience, and risk appetite, and seek professional advice where needed.
Fusion Media would like to remind you that the data contained in this website is not necessarily real-time nor accurate. The data and prices on the website are not necessarily provided by any market or exchange, but may be provided by market makers, and so prices may not be accurate and may differ from the actual price at any given market, meaning prices are indicative and not appropriate for trading purposes. Fusion Media and any provider of the data contained in this website will not accept liability for any loss or damage as a result of your trading, or your reliance on the information contained within this website.
It is prohibited to use, store, reproduce, display, modify, transmit or distribute the data contained in this website without the explicit prior written permission of Fusion Media and/or the data provider. All intellectual property rights are reserved by the providers and/or the exchange providing the data contained in this website.
Fusion Media may be compensated by the advertisers that appear on the website, based on your interaction with the advertisements or advertisers.
© 2007-2024 - Fusion Media Limited. All Rights Reserved.